In the ever-evolving landscape of genomics, Next-Generation Sequencing (NGS) has emerged as a revolutionary tool, propelling the boundaries of genetic exploration to unprecedented heights. From deciphering complex diseases to unraveling evolutionary mysteries, NGS empowers scientists with an unparalleled wealth of genomic information. However, harnessing the full potential of NGS begins with understanding the crucial process of Primary NGS Processing. This article delves deep into the intricate world of Primary NGS Processing, exploring its fundamental principles, methodologies, and significance in shaping the future of genomic research.
The Essence of Primary NGS Processing
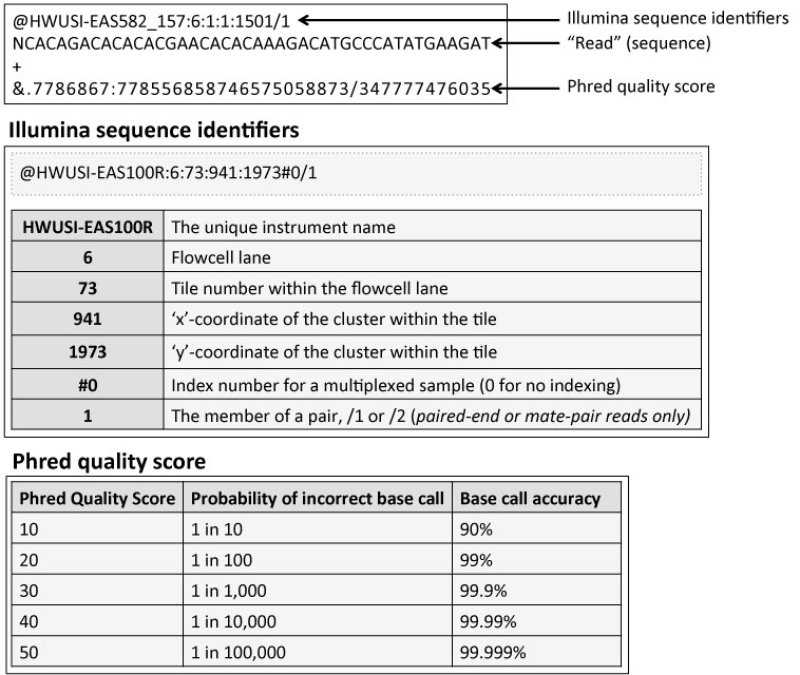
Primary NGS Processing, the first pivotal step in the NGS workflow, lays the foundation for accurate and reliable downstream analyses. It encompasses a series of intricate procedures designed to transform raw sequenced data into a decipherable format, paving the way for comprehensive genomic investigations. The essence of Primary NGS Processing lies in its ability to “call” and identify each nucleotide, providing researchers with a comprehensive glimpse into the genetic landscape.
At its core, Primary NGS Processing involves the assignment of quality scores to each nucleotide. These scores serve as critical indicators of the probability of an incorrect base call, ensuring the accuracy and integrity of the data. The outcome of this transformative process is captured in a FASTQ file, encapsulating the sequence identifiers, assigned nucleotides (also known as “reads”), and their corresponding Phred quality scores. The FASTQ format serves as the gateway to unlocking the genetic code, initiating a voyage of exploration into the depths of genomics.
Understanding Sequence Quality: The Phred Score
Central to Primary NGS Processing is the Phred quality score, a fundamental metric that underpins the reliability of sequenced data. Derived from the Phred algorithm, this score quantifies the likelihood of an erroneous base call. A higher Phred score corresponds to a greater probability of accurate base identification, instilling confidence in the subsequent analyses. In practice, the Phred quality score is encoded in the FASTQ file as an ASCII character, with its specific ASCII value reflecting the accuracy of the base calling. Researchers can use this invaluable metric to assess data quality, identify problematic regions, and make informed decisions regarding data preprocessing steps.
The primary analysis is typically automated and performed within the sequencing machine after each run, ensuring efficient processing of the generated data.
In cases where multiple samples need to be sequenced together in one run (e.g., samples from different patients or experiments), specific tags or barcodes can be assigned to each sample. These tags, short DNA sequences, are added to the adapter and serve to differentiate reads from different samples. During sequencing, these tags are also read, allowing researchers to separate and identify individual samples based on their unique adapter sequences. This process, known as multiplexing (discussed further in the last part of this article), offers several advantages, including cost-effectiveness, larger sample processing capacity, and streamlined data organization.
It is crucial to understand the concept of sequence quality, as the accuracy of NGS data greatly impacts downstream analyses. The Phred score, expressed as Q, serves as a measurement of the probability of a wrong base call in a sequence read. It is calculated using the formula Q = -10log10(e), where e represents the estimated wrong base call probability. For example, a Q score of 30 corresponds to a 1 in 1000 probability of an incorrect base call.
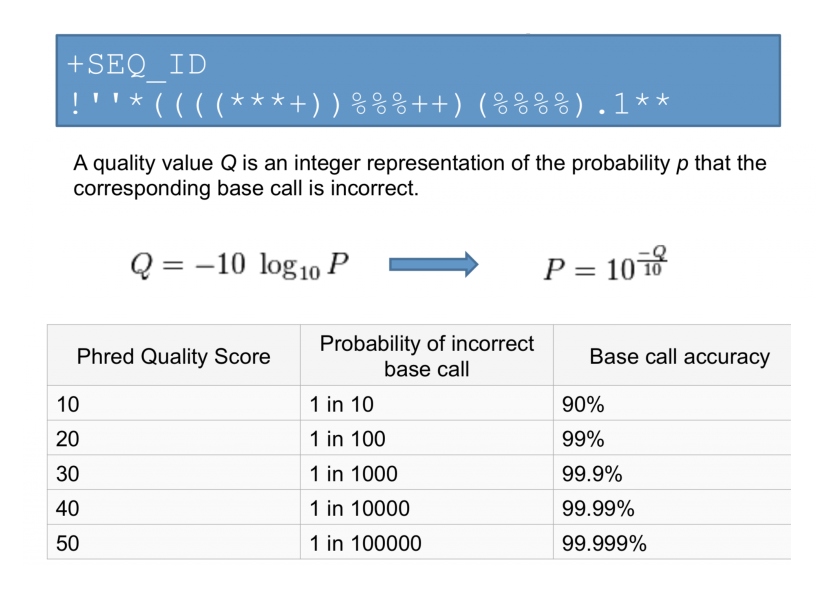
Sequence quality is encoded differently in different Illumina systems, with earlier versions (1.3, 1.5) using ASCII codes 64-126 to represent Q scores of 0-62 (Phred + 64), while more recent versions (1.8 and 1.9) use ASCII codes 33-93 (Phred + 33). Therefore, when working with raw FASTQ reads, it is essential to know the correct sequence quality encoding method to accurately assess and filter the data.
Ensuring Precision: Quality Control Checks with FastQC
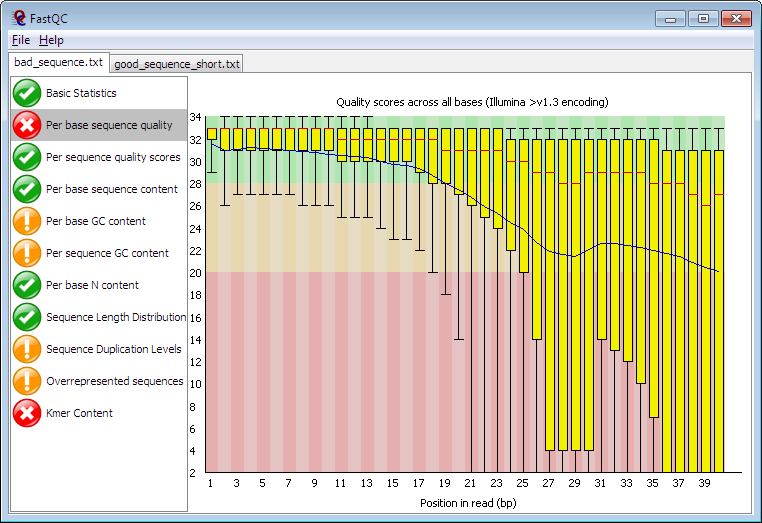
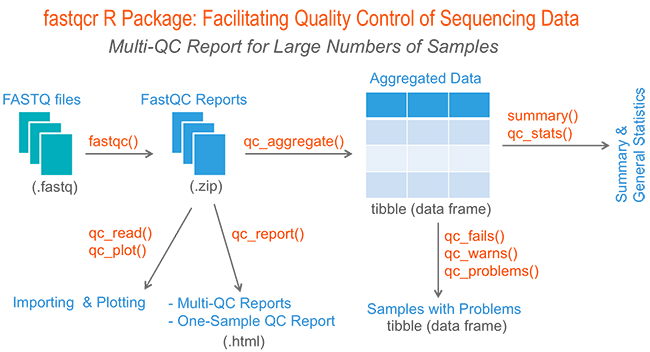
FastQC, a versatile quality control tool, emerges as a powerful ally in the realm of Primary NGS Processing. It provides a user-friendly interface to perform comprehensive quality control assessments on raw sequence data from high throughput sequencing pipelines. By offering a modular set of analyses, FastQC empowers researchers to quickly gauge potential data issues before proceeding with further analyses.
The primary functions of FastQC include importing data from BAM, SAM, or FastQ files (in any variant), enabling researchers to comprehensively analyze their datasets. Through intuitive visualizations and summary graphs, users can quickly identify problematic areas and assess the overall quality of their data. FastQC further streamlines the process by providing tables and summaries that aid in the swift evaluation of critical data attributes.
FastQC presents researchers with summary graphs and tables, delivering a comprehensive overview of the data quality. Armed with insights from this tool, scientists can efficiently identify problematic areas and swiftly address any potential issues. The ability to export results as an HTML-based permanent report ensures easy sharing and accessibility of findings, contributing to the collaborative nature of genomics research. Additionally, the tool supports offline operation, facilitating automated report generation without the need for constant interactive application execution, making it efficient and convenient for routine quality control analyses.
As introduced, FastQC provides an overview of the sequencing data quality and helps identify potential issues that may affect downstream analyses. FastQC generates various analysis modules to evaluate different aspects of the data:
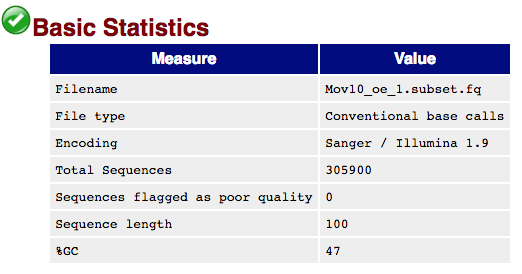
Basic Statistics: Provides general statistics and background information about the input file.
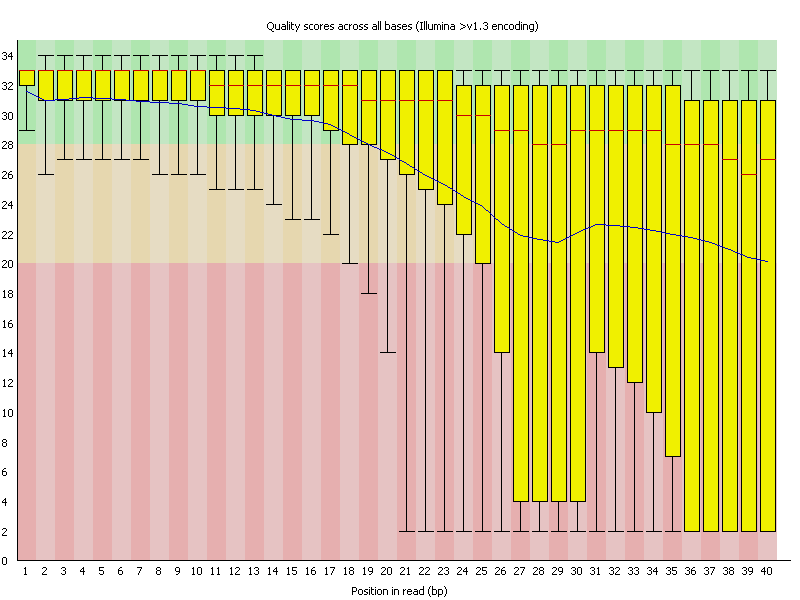
Per Base Sequence Quality: Examines the quality values across all reads in the FASTQ file, helping to identify regions of poor sequence quality.
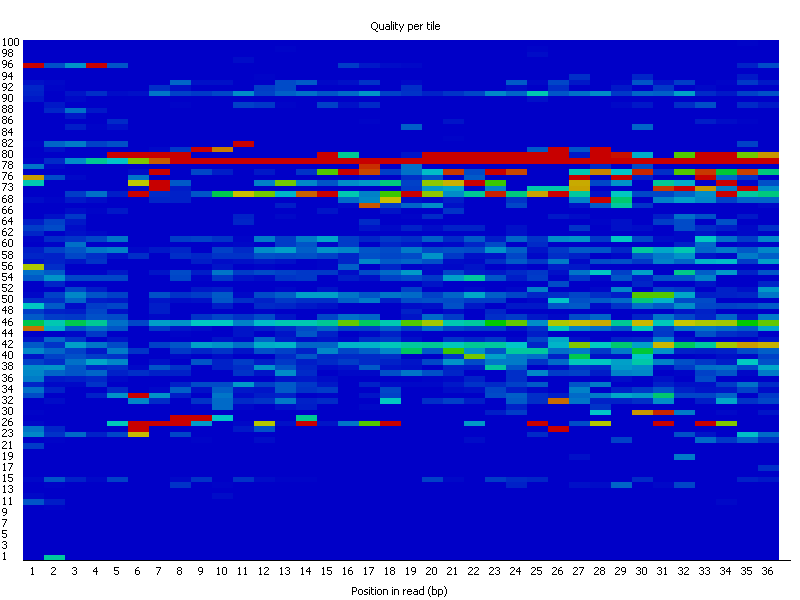
Per Tile Sequence Quality: Calculates the average quality scores from each tile across all bases, highlighting potential issues with specific tiles.
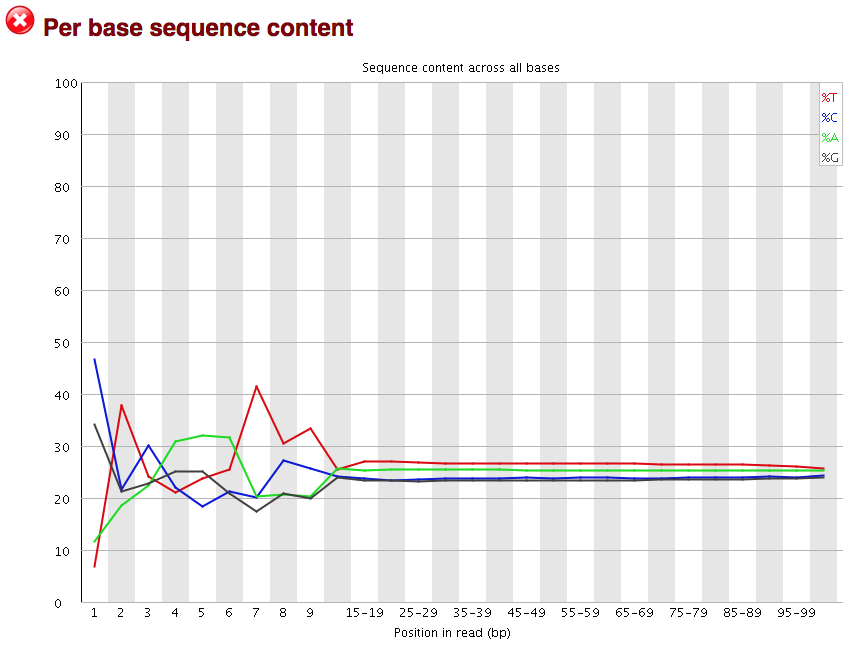
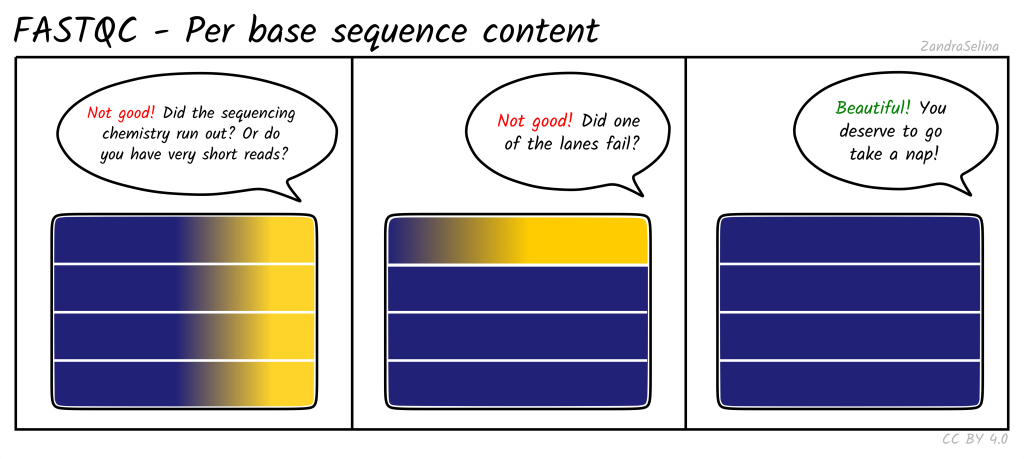
Per Base Sequence Content: Analyzes the percentage of each nucleotide (A, C, G, T) across the FASTQ reads, detecting biases in nucleotide composition.
Per Base GC Content: Evaluates the GC content across the FASTQ reads for each base position, useful for identifying regions with significant deviations.
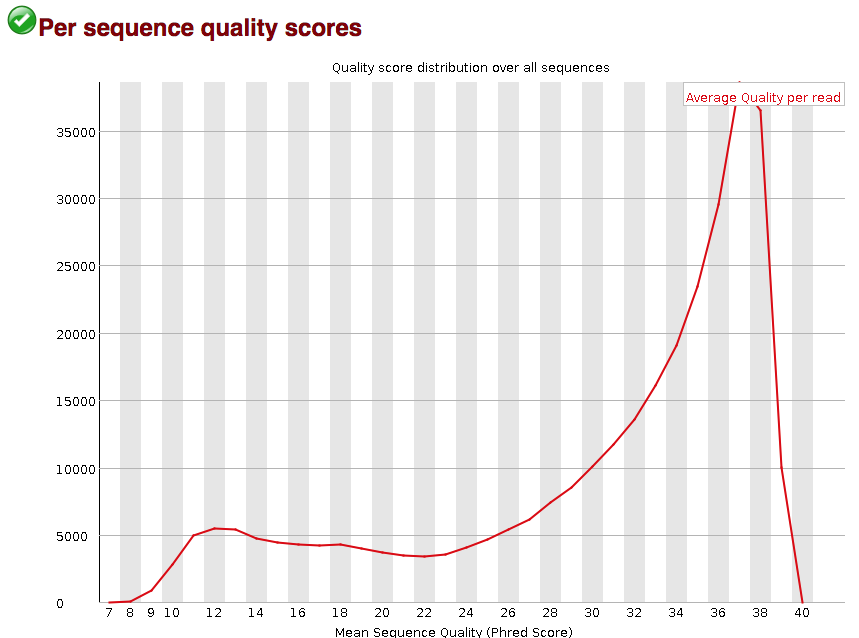
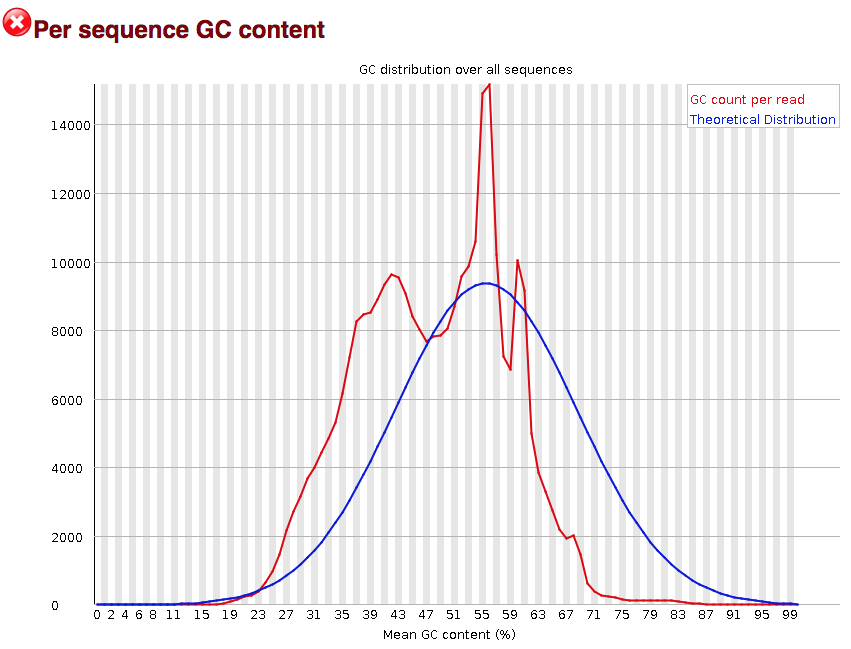
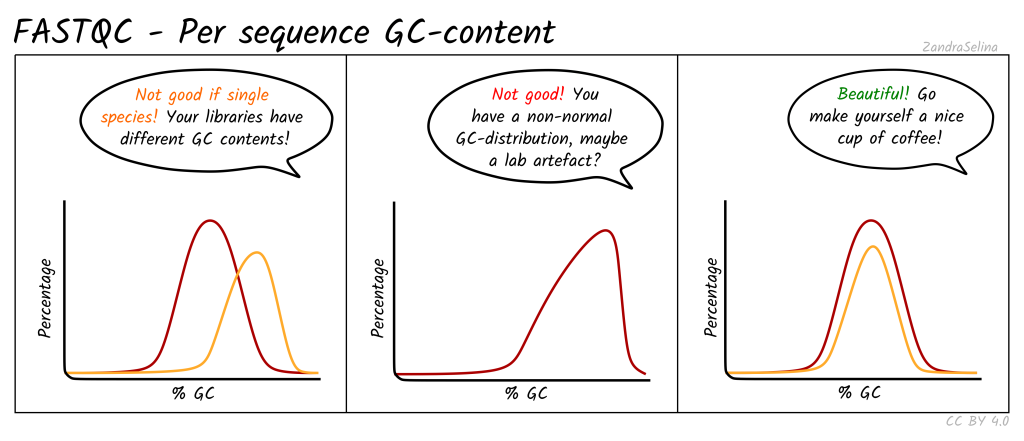
Per Sequence GC Content: Provides the average GC distribution over all sequences and compares it with a normal distribution.
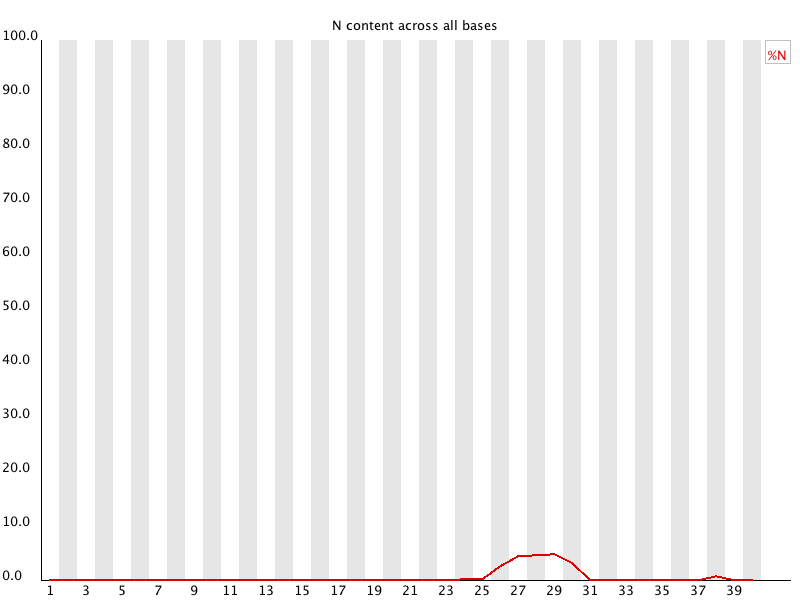
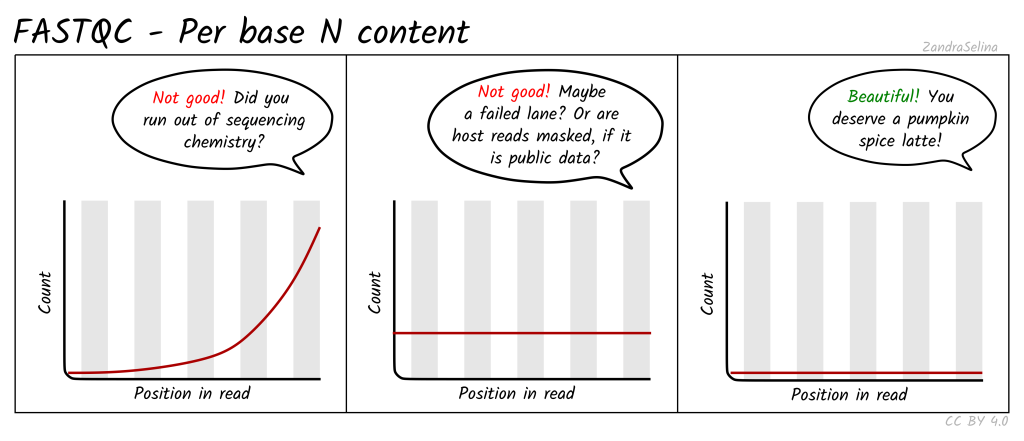
Per Base N Content: Calculates the percentage of ambiguous base calls (N) at each position in the FASTQ reads.
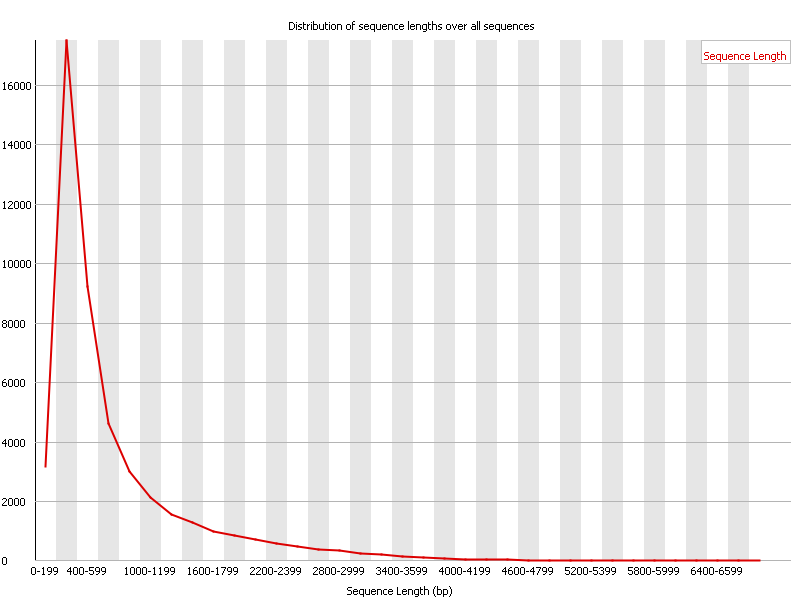
Sequence Length Distribution: Summarizes the length distribution of the FASTQ reads, useful after trimming reads.
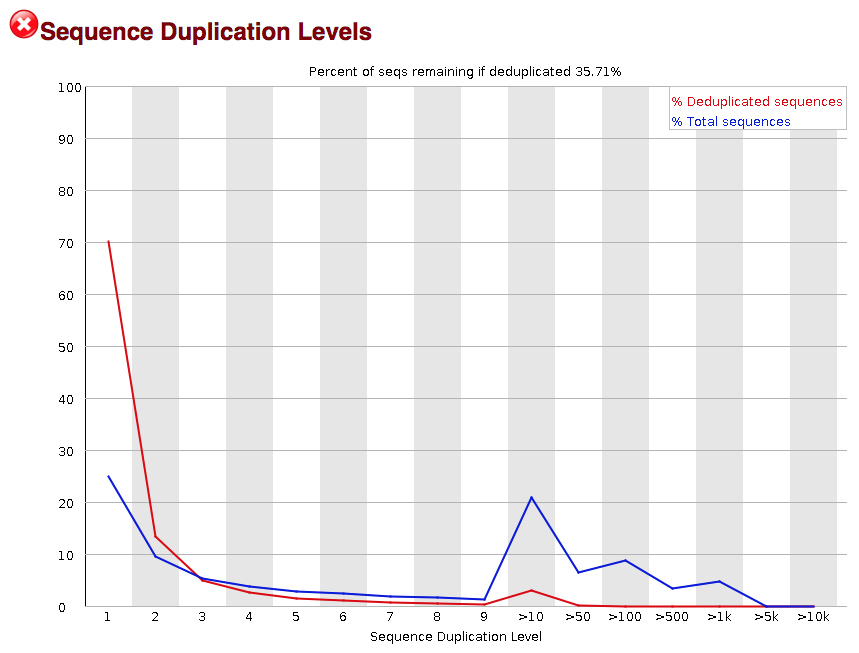
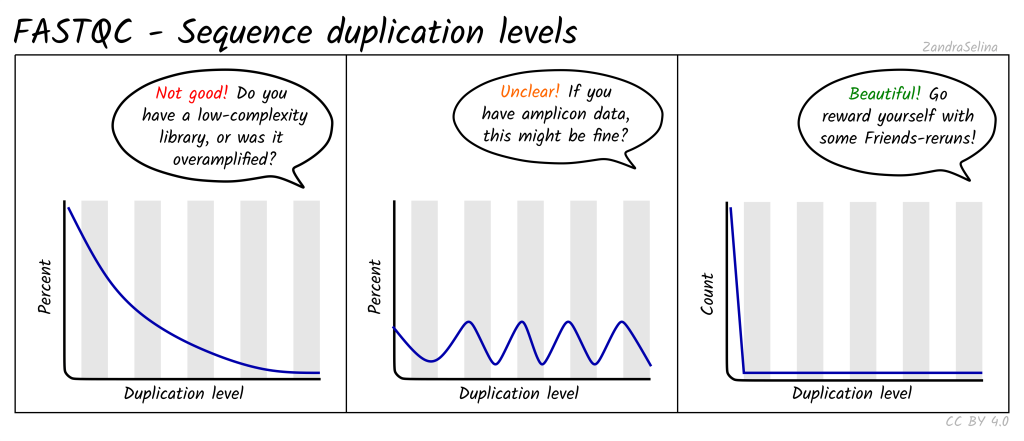
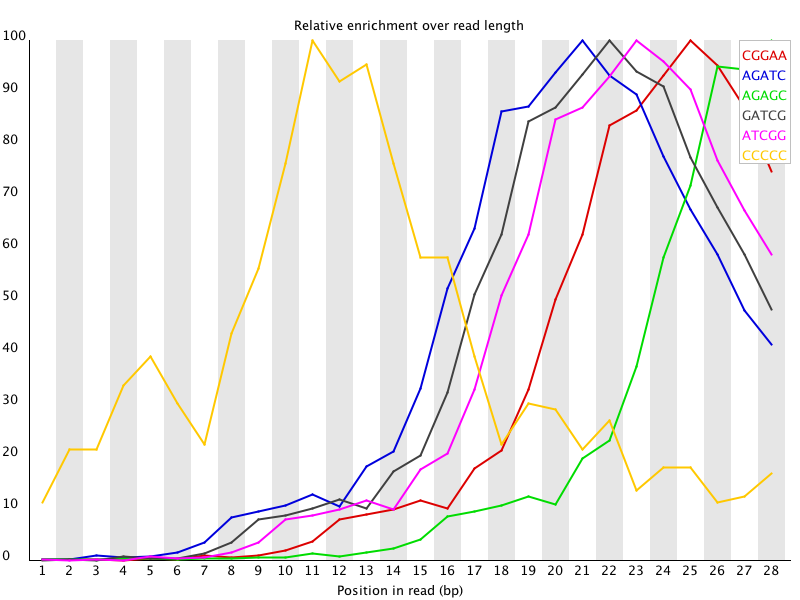
Sequence Duplication Levels: Detects biased enrichment problems such as PCR over-amplification by summarizing the counts for every sequence in the FASTQ file.
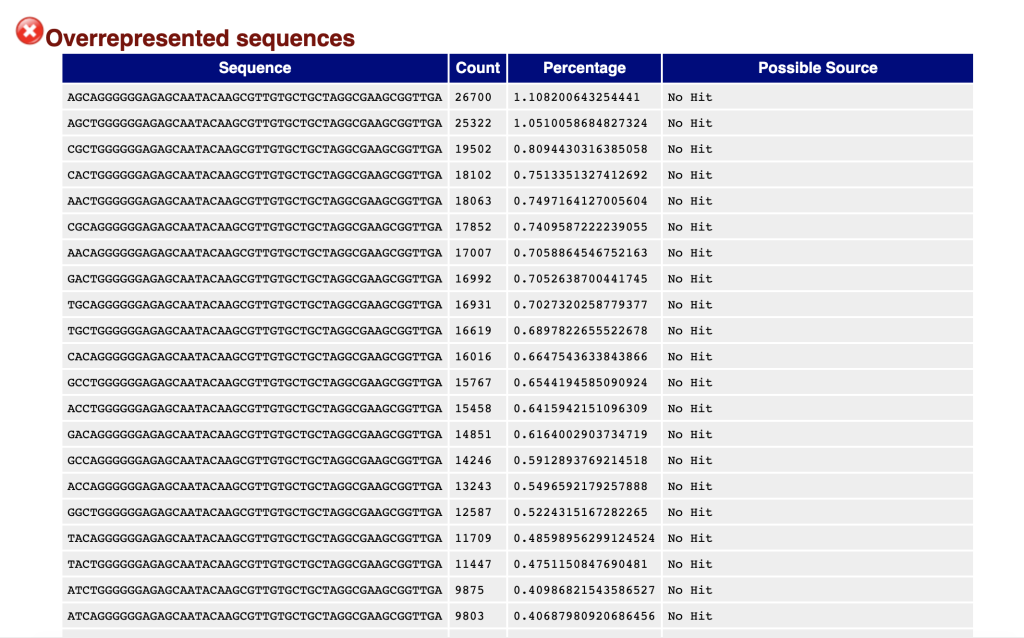
Overrepresented Sequences: Provides a frequency summary of sequences, aiding in the detection and classification of contaminants like PCR primers.
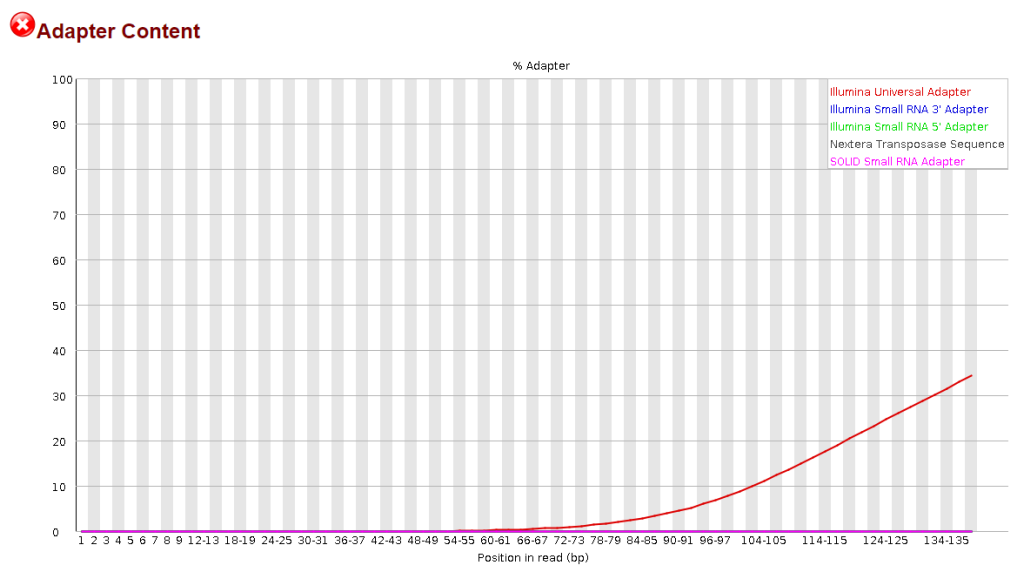
Adapter Content: Displays a cumulative plot of the fraction of reads where the sequence library adapter sequence is identified.
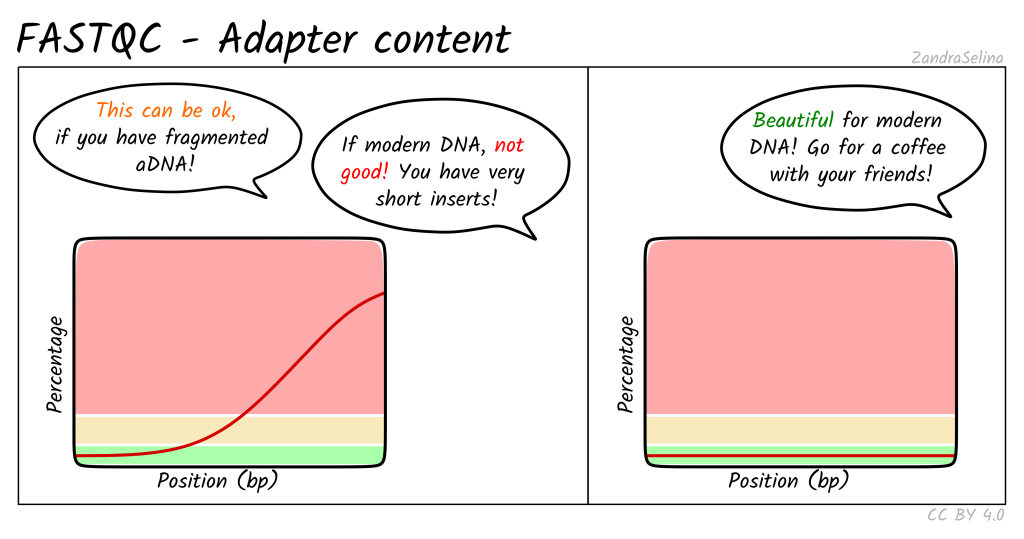
FastQC assigns symbols to represent the results of each category, indicating whether there are potential problems, acceptable results, or warnings to consider. The main focus of this tool is to identify base quality and adapter-related issues, as these often have the most significant impact on data quality.
The FastQC program is adept at identifying issues related to base and sequence quality, base content, Kmer frequency, GC content, sequence length, duplication, and potential contaminants or adapter sequences:
Base and Sequence Quality: Base and sequence quality refer to the accuracy and reliability of individual bases (nucleotides) and entire sequences, respectively, in the NGS data. Issues with base and sequence quality may arise due to sequencing errors, technical artifacts, or variations in the quality of raw data. Low-quality bases can introduce errors in downstream analyses, affecting the accuracy of variant calling, alignment, and assembly. Sequence quality issues can impact the overall reliability of biological conclusions drawn from NGS data.
Base Content: Base content refers to the distribution and proportion of different nucleotides (A, C, G, T) within a sequence read or a set of reads. Deviations in base content from the expected ratios can indicate potential biases, such as PCR amplification bias or sequencing errors. These biases can lead to misinterpretations in downstream analyses, particularly in studies involving allele-specific analysis or mutation detection.
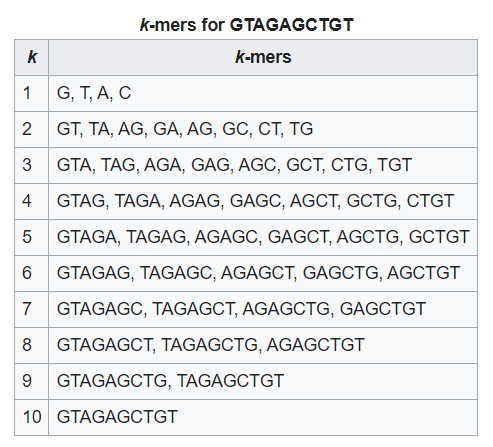
Kmer Frequency: A Kmer is a subsequence of fixed length K within a longer DNA sequence. Kmer frequency refers to the number of times each Kmer appears in the NGS data. Deviations in Kmer frequency can be indicative of technical biases, PCR duplicates, or errors during library preparation. Analyzing Kmer frequency patterns can aid in the identification of data quality issues and help researchers optimize their experimental protocols.
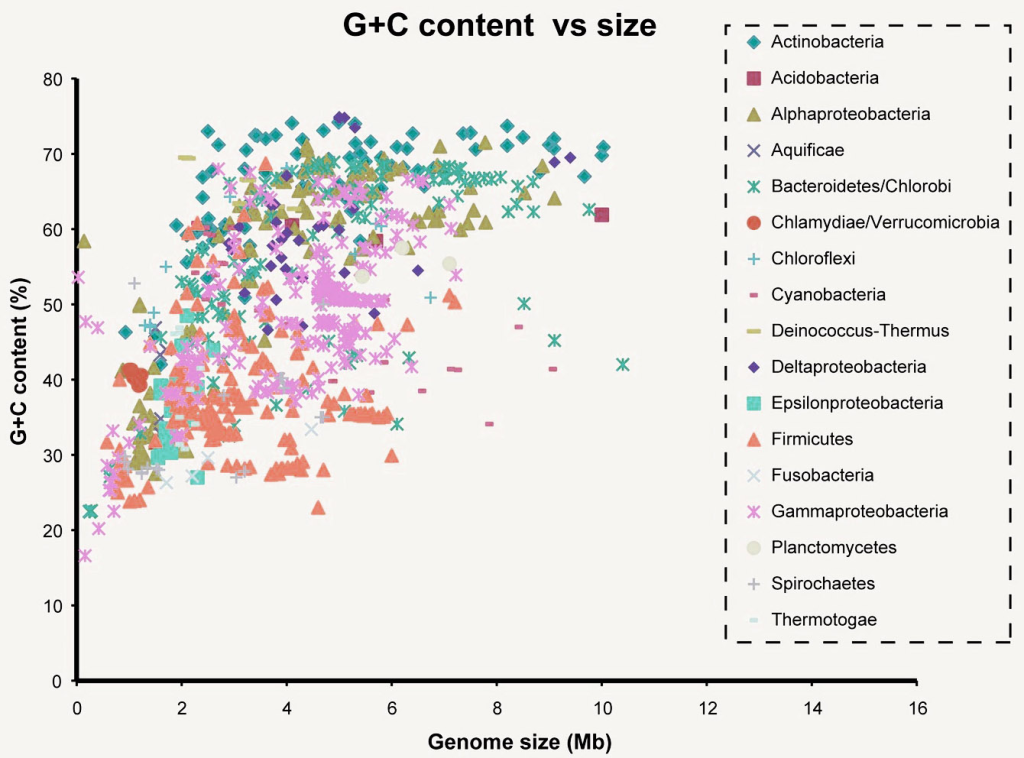
GC Content: GC content represents the percentage of Guanine (G) and Cytosine (C) bases within a DNA sequence or a set of sequences. Deviations in GC content can be associated with biases in sequencing library preparation or PCR amplification, potentially leading to inaccuracies in quantifying gene expression or detecting genomic variations. GC content analysis is essential for understanding the compositional characteristics of the sequenced DNA fragments.
Sequence Length: Sequence length refers to the number of nucleotides in a DNA sequence read. Variability in sequence lengths can arise due to various factors, including PCR amplification biases, DNA degradation during library preparation, or sequencing artifacts. Uneven sequence lengths can affect read mapping and assembly, leading to gaps or incorrect interpretations of genetic features.
Duplication: Duplication in NGS data occurs when multiple reads represent identical or highly similar DNA fragments, often arising from PCR amplification biases. Duplication can inflate the apparent coverage of certain regions, leading to erroneous conclusions in variant calling and gene expression analysis. Accurately identifying and handling duplicated reads is essential for robust and reliable data analysis.
Potential Contaminants or Adapter Sequences: Contaminants refer to unintended sequences present in the NGS data, which may originate from laboratory reagents, environmental sources, or cross-contamination between samples. Adapter sequences are short DNA fragments used during library preparation to facilitate sequencing, which may persist in the sequencing data if not adequately removed. Both contaminants and adapter sequences can interfere with downstream analyses and may result in spurious alignments or misinterpretations of the biological content in the data. Detecting and removing these sequences are crucial for obtaining reliable and biologically meaningful results.
While all of these problems can impact the quality of mapping and assembly, our experience indicates that the primary concerns lie in base quality and adapter-related challenges. Additionally, it is essential to recognize that resolving other issues may necessitate interventions during library preparation and sequencing stages, which are beyond the scope of this tutorial.
Fastx-toolkit & FASTQ Processing Utilities
Once sequence quality is assessed using FastQC, the next step is to prepare the data for further analysis. The Fastx-toolkit is a collection of powerful tools for FASTQ files preprocessing, designed to handle tasks such as FASTQ-to-FASTA conversion, barcode splitting, collapsing identical sequences, sequence renaming, reverse-complement generation, information charting, FASTA formatting, and nucleotide changing:
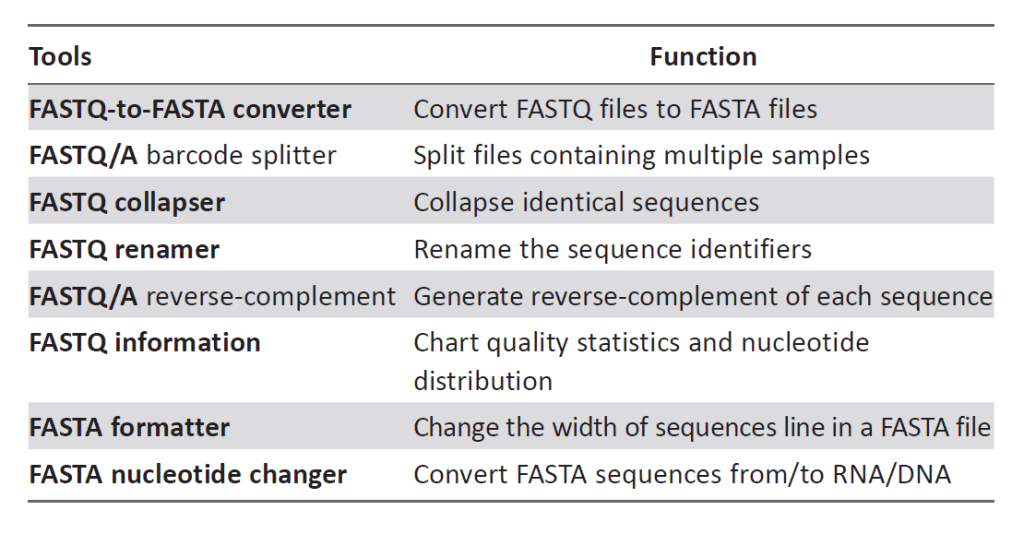
FASTQ-to-FASTA Conversion: FASTQ-to-FASTA conversion is a process of transforming sequencing data from the FASTQ format to the FASTA format. The FASTQ format contains both nucleotide sequences and corresponding quality scores for each base, whereas the FASTA format only includes the nucleotide sequence without quality information. This conversion is often performed as a preprocessing step in NGS data analysis, as some bioinformatics tools and databases may require data in the FASTA format. The process involves extracting the nucleotide sequence information from the FASTQ file and creating a new FASTA file with the same sequences.
Barcode Splitting: Barcodes, also known as indices or bar sequences, are short DNA sequences added to the sequencing libraries to enable the identification and separation of samples from multiplexed sequencing runs. Barcode splitting involves segregating sequencing reads based on the specific barcode sequences associated with each sample. This process is crucial in multi-sample sequencing experiments, where different samples are pooled and sequenced together in a single run to increase cost-efficiency. By correctly assigning reads to their respective samples using barcodes, researchers can analyze multiple samples simultaneously without the need for separate sequencing runs.
Collapsing Identical Sequences: During NGS, multiple identical sequences may arise due to PCR amplification artifacts or sequencing errors. Collapsing identical sequences is the process of merging these duplicate sequences into a single representative sequence. This step is common in data preprocessing to reduce redundancy and computational load during downstream analyses. By collapsing identical sequences, researchers can gain a more accurate representation of the underlying genetic diversity in their sample, especially when dealing with highly replicated or error-prone regions.
Sequence Renaming: Sequence renaming involves modifying or assigning new identifiers to sequences. In many cases, NGS data files may contain generic or automatically generated sequence identifiers that lack informative context. Sequence renaming allows researchers to provide more meaningful and descriptive names or identifiers for their sequences. These new names can include sample names, experimental conditions, or any other relevant information to aid in data interpretation and organization.
Reverse-Complement Generation: The reverse-complement of a DNA sequence is formed by reversing the sequence and replacing each base with its complementary base (A with T, C with G, and vice versa). Reverse-complement generation is commonly used in bioinformatics analyses, such as primer design or alignment, where it is necessary to work with the reverse complement of a sequence. For example, in PCR primer design, the reverse-complement of the target region is used as the primer sequence to amplify the DNA fragment in the opposite direction.
Information Charting: Information charting involves generating graphical representations or summary statistics of various sequence characteristics or quality metrics. In the context of NGS data analysis, information charting is commonly performed using tools like FastQC, which generates visualizations and summary reports to assess sequence quality and identify potential issues. The generated charts and graphs provide valuable insights into the quality and characteristics of the sequencing data, aiding researchers in making informed decisions regarding data filtering and further analyses.
FASTA Formatting: FASTA formatting involves adjusting the layout of sequences in a FASTA file. FASTA files typically have a maximum line width, and sequences are split into multiple lines to adhere to this width. FASTA formatting ensures that the sequences are appropriately wrapped to meet the specified line width. Well-formatted FASTA files are easier to read and handle, particularly when dealing with long or extensive sequence data.
Nucleotide Changing: Nucleotide changing refers to the conversion of DNA sequences between different nucleotide alphabets, such as changing sequences from RNA to DNA or vice versa. This process is essential in various bioinformatics analyses, where researchers may need to work with sequences in RNA format, like transcriptome data, and convert them to DNA format for compatibility with genomic data or databases. Conversely, sequences may need to be converted from DNA to RNA format for specific analyses or experimental purposes. Nucleotide changing ensures that sequences are accurately represented and used in the appropriate context throughout the analysis pipeline.
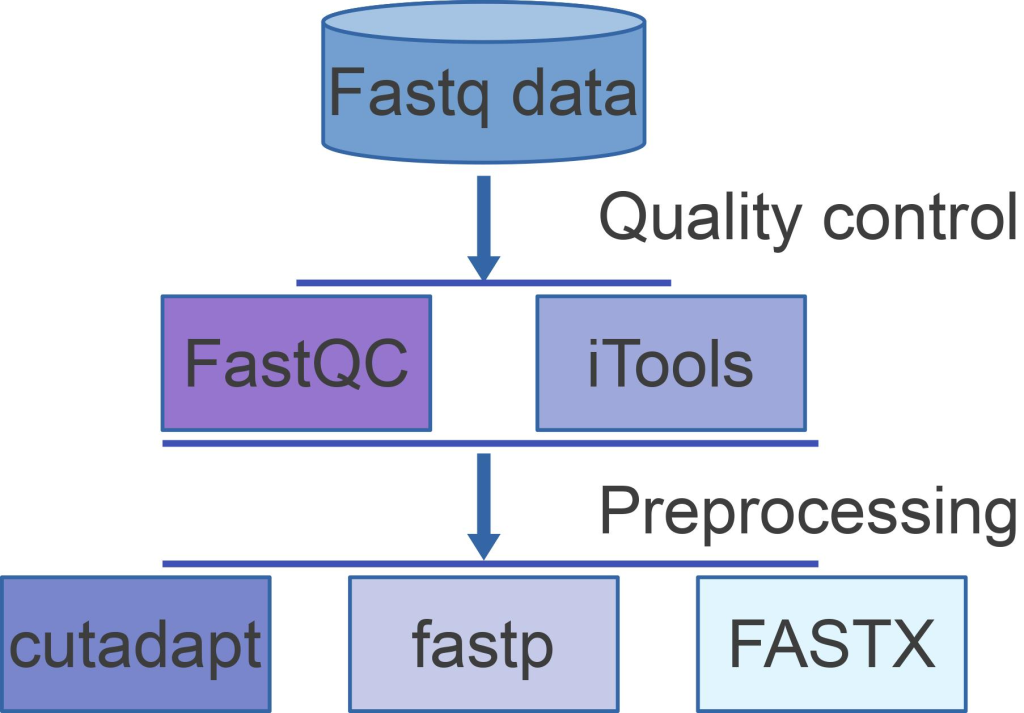
In particular, the FASTQ Quality Filter tool from the Fastx-toolkit enables users to filter sequences based on their quality scores. Low-quality bases or entire sequences can be removed or treated as ambiguous bases (Ns) according to the researcher’s preferences. This step is crucial to ensure that only high-quality data are used for subsequent analyses such as alignment or assembly. In relation to the features afforded by the Fastx-toolkit, the corresponding Tools in the Fastx-toolkit for NGS Data Preprocessing are tabulated as follows:
Multiplexing: Unlocking Efficiency and Versatility
At its core, multiplexing embodies the art of sequencing multiple samples together in a single NGS run. This ingenious approach allows researchers to pool a diverse array of samples, representing different individuals, tissues, or experimental conditions, into a unified sequencing library. As these samples are collectively processed, a remarkable surge in throughput and cost-effectiveness ensues, delivering profound benefits for the scientific community.
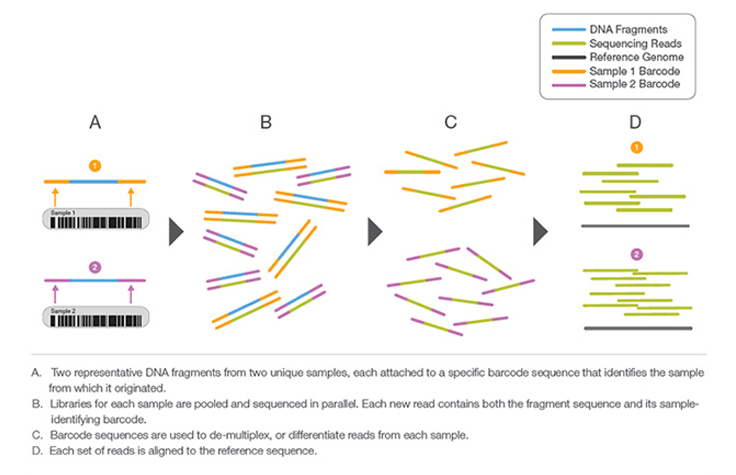
The key to the seamless integration of multiple samples lies in the ingenious use of specific tags or barcodes. By assigning unique molecular identifiers to each sample, researchers can demarcate and differentiate reads during the sequencing process. This ensures that even amidst a sea of data, the origin of each read can be precisely determined, unlocking the potential for comprehensive downstream analyses.
As the sequencing data flows in, the magic of multiplexing unfurls during Primary NGS Processing. The identification of specific adapters associated with each sample allows for rapid and efficient sample separation. With such streamlined data organization, researchers can seamlessly navigate through complex datasets, avoiding the cumbersome task of manually segregating samples.
The advantages of multiplexing extend far beyond enhanced data organization. By capitalizing on the potential of multiplexing, researchers can drastically reduce sequencing costs, making it a compelling solution for resource-constrained projects. The ability to process multiple samples simultaneously also optimizes laboratory throughput, expediting research timelines and accelerating scientific discoveries.
Additionally, multiplexing opens doors to novel experimental designs, allowing researchers to explore intricate biological phenomena with greater depth and breadth. This strategic approach empowers comprehensive comparative analyses, fostering a deeper understanding of genetic variations and dynamic cellular processes.
Addressing the Multiplexing Challenges in Next-Generation Sequencing
However, there are a few challenges with multiplexing. Let’s examine the difficulties associated with index misassignment and concurrent sample preparation and how we might resolve them to enhance productivity and data quality, thereby lowering the expenditure per specimen.
Understanding Index Misassignment
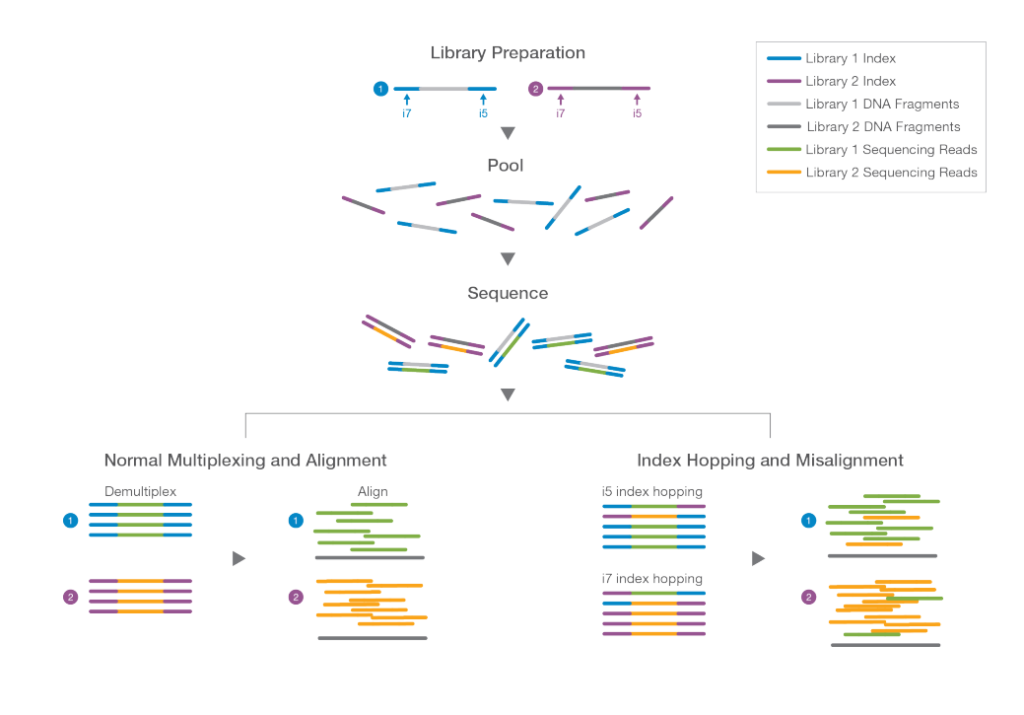
The process of multiplexing involves tagging individual libraries with indexing barcodes before pooling and running them on a single flow cell. This allows the sequencing data to be separated and attributed to the respective libraries during analysis. However, index misassignment occurs when a read for a molecule in one library is mistakenly assigned to another, leading to complications in data analysis. Such events, while relatively infrequent (approximately 1-2% but can be higher), can accumulate into a significant problem due to the large number of sequences involved.
Index misassignment is particularly concerning in applications like low-frequency allele detection, where differentiating true and false positives becomes challenging, or in scenarios with limited sample availability, where maximizing yield is essential.
Addressing Index Misassignment
To tackle index misassignment, researchers have investigated the phenomenon of ‘index hopping.’ This process involves contaminating free adapters and index primers binding to clustered molecules on flow cells. During clonal amplification, these contaminants can generate reads with another library’s index. Illumina’s ExAmp clustering chemistry has been found to exhibit a higher incidence of index hopping compared to the older bridge amplification method.
To mitigate index misassignment, the adoption of dual indexing and unique molecular identifiers (UMIs) has proven effective. Using two distinct indexes or UMIs for each library enables the software to discard any reads that lack the correct combination of identifiers, enhancing data accuracy and reliability.
Understanding Parallel Sample Preparation
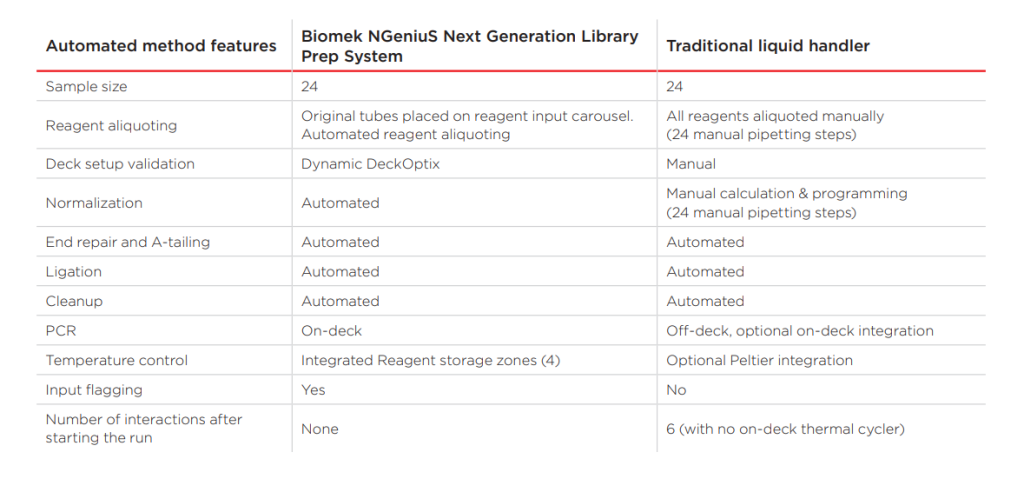
Parallel sample preparation involves simultaneously preparing multiple individual libraries for multiplexing. While it optimizes the use of NGS capacity, it introduces additional complexities and potential sources of error. Traditional methods of preparing a few libraries manually over several days are insufficient when dealing with hundreds or thousands of samples within a competitive timeframe.
Multiplexing libraries with different fragment sizes also presents a challenge as smaller fragments are more efficiently sequenced than larger ones, causing inconsistencies in read depth. Precise quantitation, fragment size identification, and normalization are essential to generate high-quality, reproducible data.
Solving the Sample Preparation Challenge
Automation can partially alleviate the issues associated with parallel sample preparation. However, a more efficient workflow is needed to minimize user-induced variation and reduce the overall workload. Pooling libraries at an early stage, followed by processing them together, represents a practical solution. In this scenario, easy or automatic barcoding and normalization of libraries are crucial.
A promising approach involves incorporating a simple molecular tagging step for each library, allowing equimolar quantities of fragments to be extracted. This eliminates the need for separate quantitation and normalization steps, streamlining the workflow and ensuring seamless integration into existing protocols.
Conclusion
As the genomic frontier continues to expand, Primary NGS Processing stands as an essential gateway to the realms of genetic exploration. By understanding and harnessing the power of this foundational step, scientists can unlock a treasure trove of genetic insights, driving advancements in medicine, agriculture, and beyond. As technology evolves and genomics research progresses, mastering the art of Primary NGS Processing remains paramount, guiding researchers towards groundbreaking discoveries that will shape the future of genomic science. While this article may not introduce the actual programming needed to perform computational tasks in biology for analysis purposes, it has no doubt introduced major themes on how data from genomics sequences are gathered, assessed for quality, and finally pre-processed, which are necessary steps before proceeding to read cleanup, alignment, mutation calling, and gene expression analysis – the steps in Secondary NGS Analysis.
Engr. Dex Marco Tiu Guibelondo, BS Pharm, RPh, BS CpE
Editor-in-Chief, PharmaFEATURES

Subscribe
to get our
LATEST NEWS
Related Posts

Bioinformatics & Multiomics
Data Deluge: Why Biomedical Informatics Must Reengineer Itself for the Era of Scientific Big Data
Biomedical big data is the scientific infrastructure that turns massive biological and clinical information streams into actionable medical knowledge.

Bioinformatics & Multiomics
Network Medicines: How AI is Teaching Small Molecules to Think in Pathways
AI-driven polypharmacology treats a small molecule not as a single-target bullet, but as a network-calibrated intervention designed for the real complexity of human disease.

Bioinformatics & Multiomics
Agentic Bioinformatics: How Autonomous AI Agents Compress Biomedical Discovery Cycles
Agentic bioinformatics treats biomedical discovery as a closed-loop system where specialized AI agents continuously translate intent into computation, computation into evidence, and evidence into the next experiment.

Bioinformatics & Multiomics
Proteomic Signatures: Molecular Discrimination of Hyperinflammatory States Through Serum Proteome Architecture
Serum proteomics exposes how sepsis and hemophagocytic syndromes diverge at the level of immune regulation and proteostasis, enabling precise molecular discrimination.
Read More Articles


Medicinal Chemistry & Pharmacology
April 14, 2026
Igor Nasonkin and Phythera Therapeutics: Moving Oncology Beyond Single Targets into Engineered Polypharmacologic Systems
Igor Nasonkin’s systems-driven approach at Phythera Therapeutics reframes oncology drug development from single-target inhibition to AI-enabled polypharmacologic network modulation using nature-derived molecular architectures.


Artificial Intelligence and Data Analytics
April 10, 2026
Inside Johnson & Johnson’s External Innovation Engine: Devin Swanson on Translating Integrated Discovery into Strategic Value
Devin Swanson’s leadership at Johnson & Johnson Innovative Medicines redefines external innovation as a tightly governed, AI-enabled translational system integrating multi-modal drug discovery, biomarker strategy, and capital-efficient execution.

Immunology & Oncology
April 9, 2026
From DMPK to Distributed Execution: Mehran F. Moghaddam’s Systems Strategy at OROX BioSciences, Inc.
A systems-level examination of how Mehran F. Moghaddam operationalizes DMPK, externalized R&D, and lipid-mediated therapeutics into a predictive, high-velocity biotech development architecture.