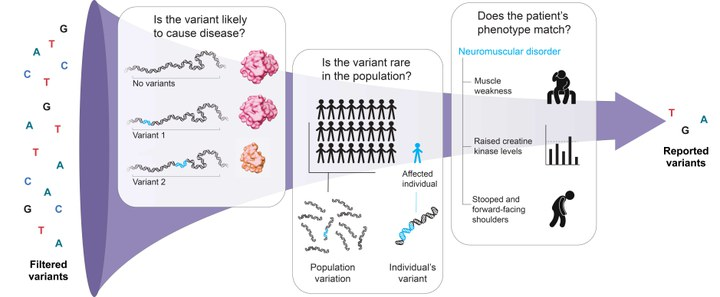
Next-Generation Sequencing (NGS) has revolutionized the field of clinical genetics, enabling the rapid and cost-effective analysis of an individual’s entire genome or exome. However, the real challenge lies not in generating vast amounts of sequencing data but in deciphering its significance in the context of human health and disease. Tertiary analysis, the third step in the NGS analysis pipeline, is the critical phase where the puzzle pieces of genetic variants are connected to the observed patient phenotype. In this article, we delve into the intricate world of tertiary NGS data analysis, exploring the essential steps of variant annotation, filtering, prioritization, and visualization that contribute to the interpretation of genetic variants. In the last part of this bioinformatics primer, we’ll identify the challenges that face NGS and the means to address them.
Variant Annotation: Unraveling the Biological Context
VARIANT ANNOTATION ALGORITHMS
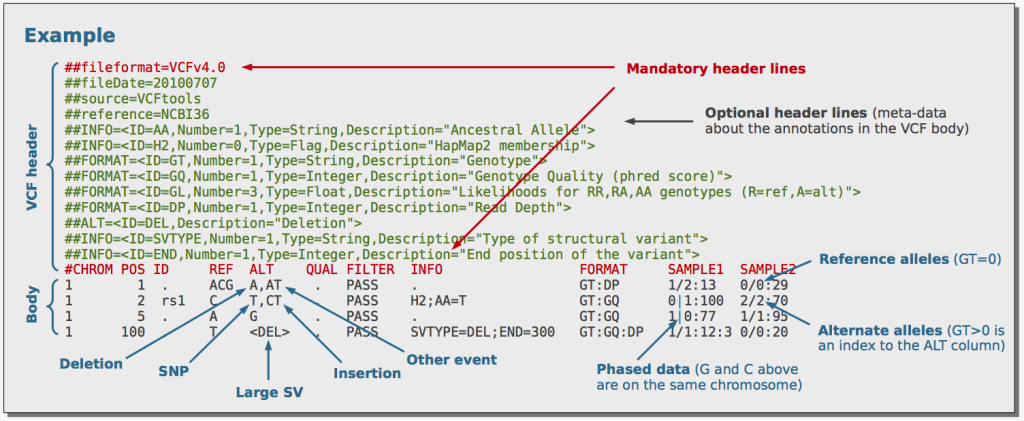
The journey of tertiary NGS data analysis begins with variant annotation, where the biological context of each variant is illuminated. After the initial variant calling step, the output is a Variant Call Format (VCF) file containing essential information about variants, such as genomic position and alternate bases. However, this data lacks crucial biological details that connect the variant to its functional impact on genes and proteins.
Variant annotation tools come to the rescue, providing essential information about the functional consequences of identified variants. These tools integrate various algorithms, such as SIFT, PolyPhen-2, CADD, and Condel, to predict the impact of variants based on parameters like amino acid conservation, evolutionary conservation, and protein structure:
SIFT (Sorting Intolerant From Tolerant)
SIFT is a bioinformatics tool that assesses the potential impact of amino acid substitutions caused by missense variants. It is based on the principle that important amino acid residues are conserved across evolution, and any substitution in these conserved regions might be detrimental to protein function. SIFT evaluates the degree of conservation of amino acid residues at a given position and predicts whether a variant is likely to be deleterious or tolerated. Variants with lower SIFT scores are considered more likely to be damaging, while those with higher scores are predicted to be tolerated.
PolyPhen-2 (Polymorphism Phenotyping v2)
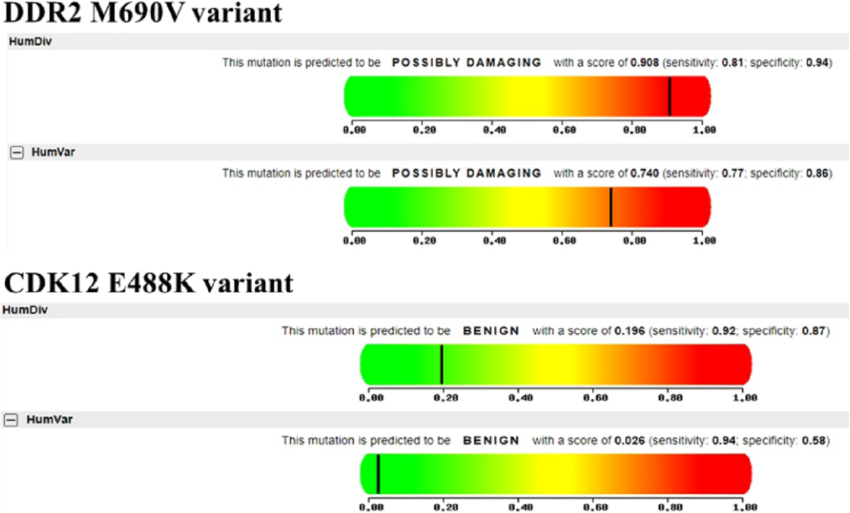
PolyPhen-2 is another widely used tool for predicting the functional impact of missense variants. It incorporates various features, such as sequence-based and structure-based predictions, to evaluate the potential effects of amino acid substitutions on protein structure and function. PolyPhen-2 generates a score indicating the probability of a variant being “probably damaging,” “possibly damaging,” or “benign.” Variants with high PolyPhen-2 scores are more likely to be pathogenic and associated with disease.
CADD (Combined Annotation Dependent Depletion)
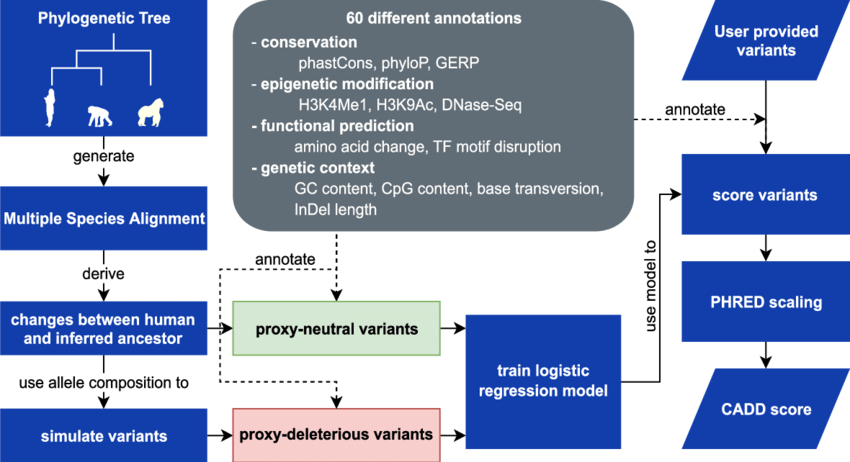
CADD is a relatively newer tool that combines multiple annotations, including evolutionary conservation, regulatory elements, and functional genomic data, to predict the deleteriousness of genetic variants. CADD scores are normalized and scaled to create a ranking system, where higher scores indicate variants that are more likely to be pathogenic. CADD has gained popularity due to its ability to integrate diverse genomic data and provide a comprehensive assessment of variant deleteriousness.
Condel (Conservation and Deletion)
Condel is a variant prioritization tool that takes into account both conservation scores and the impact of variants on protein function. It integrates the output of SIFT and PolyPhen-2, combining their scores to generate a final prediction of variant pathogenicity. This integration enhances the accuracy of variant prioritization by considering multiple aspects of variant impact.
VARIANT DATABASES
Annotation tools often draw information from disease variant databases like ClinVar, HGMD, OMIM, and many others offering insights into the clinical relevance of the identified variants.
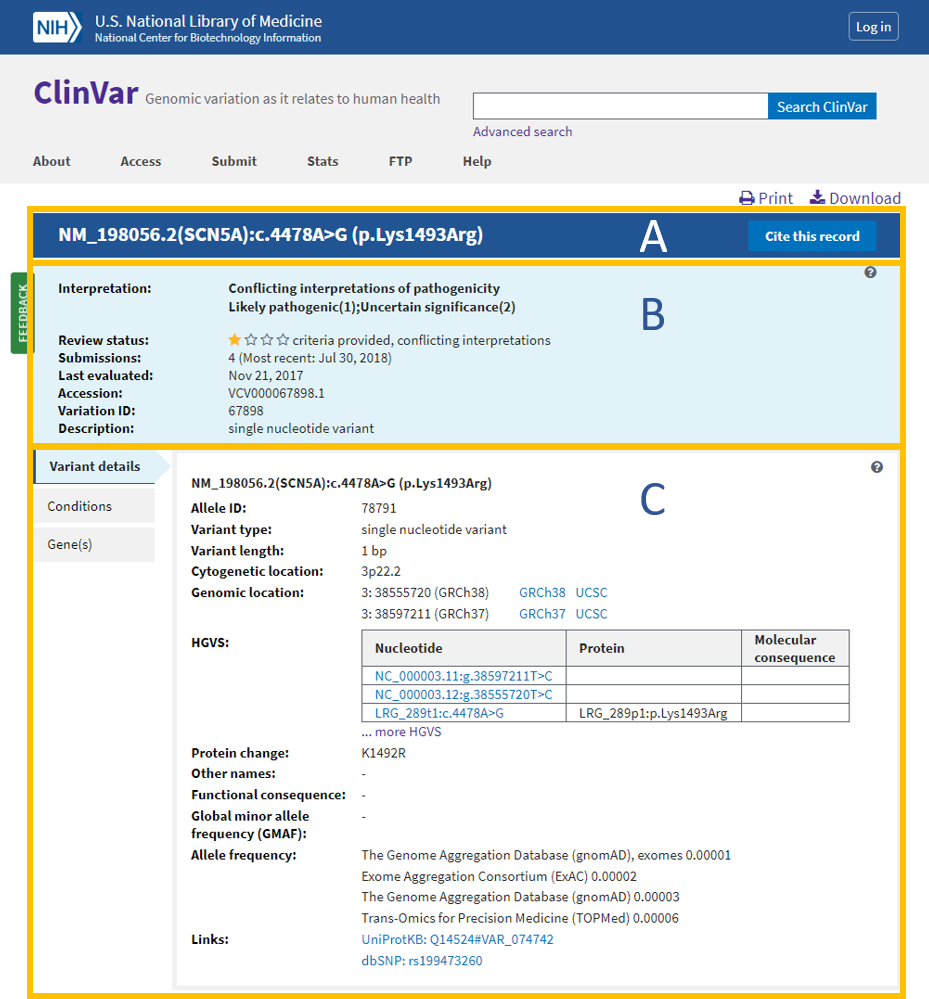
ClinVar
Overview: ClinVar is a public and freely accessible database maintained by the National Center for Biotechnology Information (NCBI). It serves as a central repository for clinically relevant genetic variants and their associations with human health and diseases. ClinVar collects data from various sources, including research studies, diagnostic laboratories, and expert panels, providing a comprehensive resource for variant interpretation and clinical decision-making.
Data Collection and Curation: ClinVar gathers variant data, along with their interpretations, from multiple submitters, such as clinical laboratories, researchers, and experts. These submissions undergo careful curation to ensure accuracy and relevance. ClinVar’s expert curation team evaluates the clinical significance of variants based on available evidence and published literature.
Variant Interpretation: ClinVar classifies variants into different categories based on their clinical significance. These categories include “pathogenic,” “likely pathogenic,” “benign,” “likely benign,” “uncertain significance,” and others. The variant classifications aid clinicians and researchers in determining the potential impact of genetic variants on patient health.
Data Accessibility and Integration: ClinVar provides a user-friendly interface that allows easy access to variant data, annotations, and clinical interpretations. It also integrates with other genomic resources and tools, facilitating data exchange and supporting variant annotation in genomic analysis pipelines.
Applications: ClinVar is a valuable resource for clinical geneticists, researchers, and healthcare providers. It aids in variant interpretation, supports genetic counseling, and informs clinical decision-making. Clinicians use ClinVar to access information about genetic variants that may be associated with specific diseases or conditions, helping in the diagnosis and management of patients with genetic disorders.
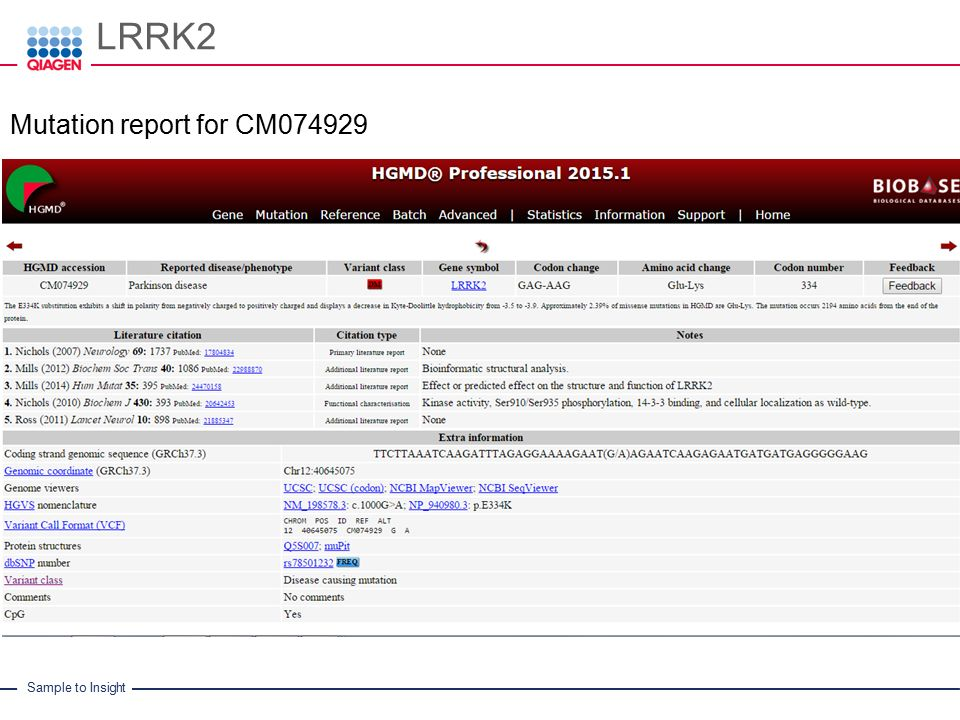
HGMD (Human Gene Mutation Database)
Overview: HGMD, the Human Gene Mutation Database, is a comprehensive repository of germline and somatic mutations implicated in human inherited diseases and cancers, respectively. HGMD focuses on disease-causing mutations, particularly in Mendelian disorders, making it a valuable resource for researchers investigating the genetic basis of monogenic diseases.
Data Sources and Curation: HGMD compiles data from published literature, locus-specific databases, and other publicly available sources. The database curates and verifies variant data to ensure its accuracy and reliability. HGMD’s stringent curation process aims to provide a high-quality resource for researchers and clinicians.
Disease Associations: HGMD includes associations between genetic variants and specific diseases or conditions. It catalogs information about the genetic basis of various Mendelian disorders, providing insights into the molecular mechanisms underlying these diseases.
Variant Information: HGMD offers detailed information about each variant, including its genomic coordinates, reference and alternate alleles, mutation type, and functional consequences. Researchers can access data on the specific phenotypes associated with each variant, aiding in genotype-phenotype correlation studies.
Applications: HGMD is widely used in genetic research and clinical genetics. It supports variant interpretation in the context of monogenic diseases and facilitates the identification of disease-causing mutations. Researchers and clinicians use HGMD to prioritize variants for further investigation and assess their clinical significance.
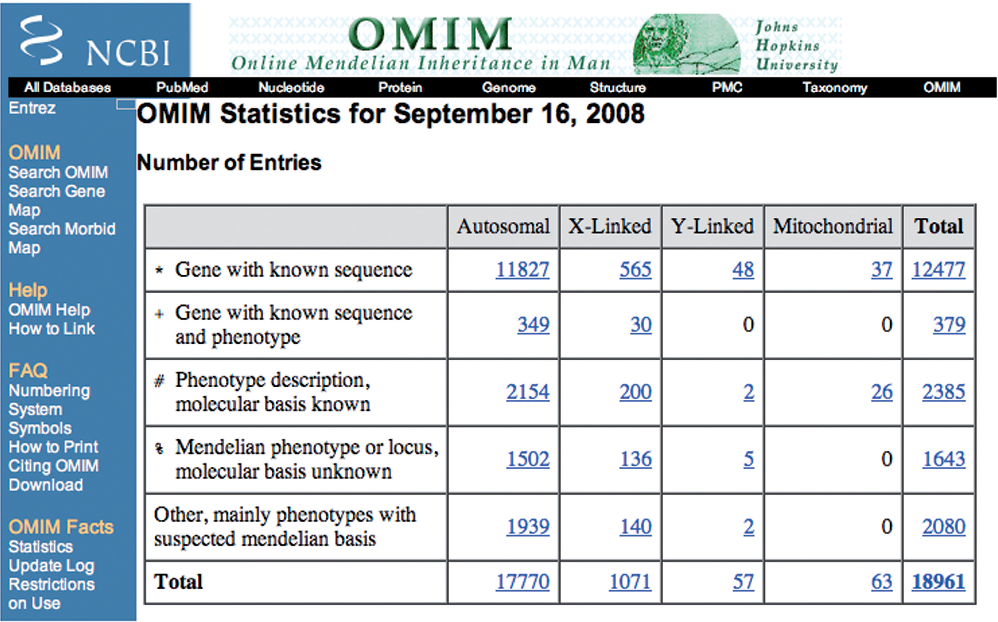
OMIM (Online Mendelian Inheritance in Man)
Overview: OMIM is a comprehensive and authoritative knowledge base that provides information on human genes and genetic disorders. Developed by the Johns Hopkins University School of Medicine, OMIM serves as a critical resource for researchers, clinicians, and genetic counselors seeking information about genetic conditions.
Gene and Disorder Information: OMIM includes detailed entries for individual genes and genetic disorders, providing information about gene function, disease manifestations, inheritance patterns, and associated phenotypes. Each entry contains curated data from the scientific literature, ensuring the accuracy and reliability of the information.
Phenotypic Descriptions: OMIM offers comprehensive phenotypic descriptions for various genetic disorders. These descriptions help clinicians recognize clinical features and manifestations associated with specific genetic conditions, aiding in accurate diagnosis and patient management.
Genetic Locus and Allelic Variants: OMIM provides data on genetic loci associated with specific disorders, as well as information about allelic variants and their phenotypic effects. Researchers can access variant-specific data and explore the molecular basis of disease manifestations.
Applications: OMIM is a valuable resource for researchers studying the genetic basis of human diseases, clinicians diagnosing genetic disorders, and genetic counselors providing information and support to patients and families affected by genetic conditions. OMIM plays a crucial role in advancing our understanding of human genetics and the molecular basis of genetic diseases.
ESP (Exome Sequencing Project)
Overview: The Exome Sequencing Project (ESP) was a collaborative effort by the National Heart, Lung, and Blood Institute (NHLBI) and the National Human Genome Research Institute (NHGRI) aimed at sequencing the protein-coding regions of the human genome, known as the exome, in a diverse population. The primary goal of ESP was to identify genetic variants associated with various complex diseases and traits.
Population Diversity: ESP included individuals from diverse ethnic backgrounds and populations, making it a valuable resource for studying genetic variation across different groups. By encompassing a broad range of genetic diversity, ESP provided insights into the genetic architecture of various diseases and trait associations in different populations.
Sample Size and Data Collection: The project involved the exome sequencing of over 6,500 individuals, making it one of the largest and most comprehensive exome sequencing efforts at the time. This substantial sample size allowed for the identification of rare and low-frequency variants, which are often crucial for understanding the genetic basis of complex diseases.
Disease Associations: ESP contributed significantly to the discovery of genetic variants associated with a wide range of complex diseases, including cardiovascular diseases, metabolic disorders, and neurological conditions. The project’s findings have advanced our understanding of the genetic underpinnings of various human diseases.
Data Availability and Access: The ESP data, including variant frequencies and functional annotations, is publicly available, making it a valuable resource for researchers worldwide. The open-access nature of the data has facilitated collaboration and data sharing, promoting further research on disease genetics.
Functional Annotations: ESP provided functional annotations for variants, offering information about the impact of genetic variants on genes and proteins. These annotations aid researchers in assessing the potential functional consequences of variants and identifying potential disease-causing mutations.
Challenges and Limitations: While ESP significantly expanded our knowledge of genetic variation, it had certain limitations. One limitation was the focus on exome sequencing, which primarily targets protein-coding regions. Thus, it may miss variants in non-coding regions that can also have functional consequences. Additionally, the project’s focus on common diseases may limit its applicability to rare genetic disorders.
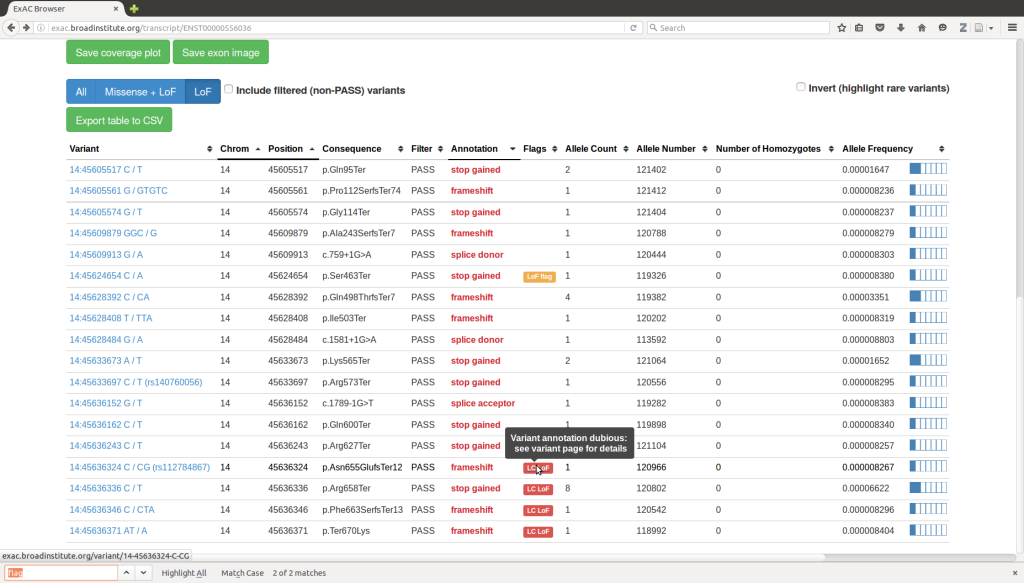
ExAC (Exome Aggregation Consortium)
Overview: The Exome Aggregation Consortium (ExAC) is an extensive database that builds upon the foundations of ESP and includes exome sequencing data from tens of thousands of individuals. ExAC aims to provide a more comprehensive and diverse collection of genetic variants in the human population.
Population Diversity: ExAC encompasses data from a vast array of populations worldwide, offering a more comprehensive representation of genetic variation than ESP. By including exome data from over 60,000 individuals, ExAC provides a broader understanding of human genetic diversity and variant frequencies.
Variant Frequencies: ExAC offers allele frequencies for a wide range of genetic variants, allowing researchers to assess the prevalence of variants in different populations. This frequency information is crucial for distinguishing rare disease-causing variants from common benign variants and prioritizing variants for further investigation.
Functional Annotations: ExAC provides functional annotations for variants, including their impact on genes, protein-coding sequences, and regulatory regions. These annotations assist researchers in evaluating the functional significance of genetic variants and understanding their potential roles in disease.
Data Quality and Filtering: ExAC employs stringent quality control measures to ensure the accuracy and reliability of variant data. It provides information on various quality metrics, enabling researchers to filter out low-quality variants and focus on high-confidence data.
Data Accessibility and Integration: ExAC’s user-friendly interface allows researchers to access and query variant data easily. The database is integrated with various tools and resources, promoting data exchange and facilitating data integration with other genomic databases and analysis pipelines.
Applications: ExAC has been instrumental in population genetics studies, disease association analyses, and variant interpretation for both research and clinical purposes. The database serves as a valuable reference for researchers and clinicians seeking to understand the global patterns of genetic variation and identify potentially pathogenic variants in specific populations.
Challenges and Future Directions: Despite its comprehensive nature, ExAC is not without limitations. The database may not capture rare variants specific to smaller or underrepresented populations. Additionally, as new sequencing data becomes available, updating and expanding the database is an ongoing challenge to keep it current and relevant.
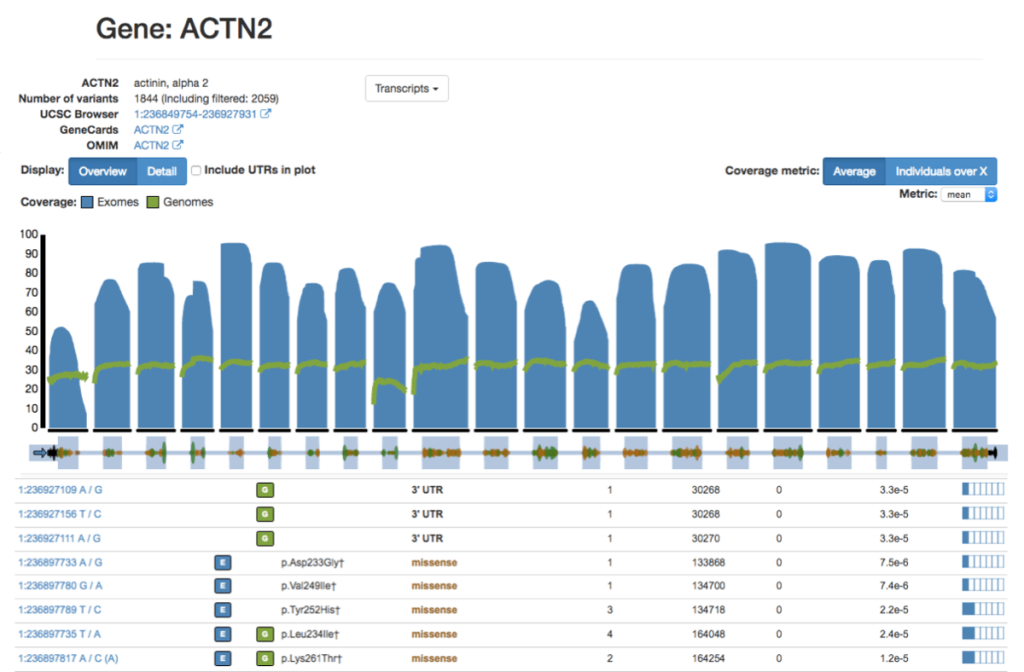
gnomAD (Genome Aggregation Database)
Overview: The Genome Aggregation Database (gnomAD) is a large-scale population genetics database that consolidates genomic data from thousands of individuals across diverse populations. It is an extension of the Exome Aggregation Consortium (ExAC) and provides an even more extensive collection of genetic variants, including both exonic and non-exonic regions from whole-genome sequencing data.
Population Diversity: One of the key strengths of gnomAD is its inclusion of data from various populations worldwide. By encompassing individuals from different ethnic backgrounds and geographic regions, gnomAD offers a comprehensive representation of genetic variation in the human population. This diversity is essential for accurate variant frequency estimation and the identification of population-specific variants.
Variant Frequencies: gnomAD provides allele frequencies for a vast number of genetic variants, making it a valuable resource for researchers studying the distribution of variants in the general population. The allele frequency data helps distinguish rare disease-causing variants from common benign variants, aiding in the interpretation and prioritization of variants in clinical and research contexts.
Functional Annotations: In addition to variant frequencies, gnomAD offers functional annotations for variants, including information about their impact on genes, protein-coding sequences, and regulatory regions. These annotations are valuable for assessing the potential functional consequences of genetic variants and understanding their potential roles in disease.
Variant Quality Metrics: gnomAD employs stringent quality control measures to ensure the accuracy and reliability of variant data. The database provides various quality metrics, such as read depth, genotype quality, and variant calling statistics, which researchers can use to filter out low-quality variants and focus on high-confidence data.
Data Accessibility: gnomAD provides a user-friendly interface that allows researchers to explore and query variant data easily. It offers flexible data access options, including variant-specific information, gene-based annotations, and aggregated variant statistics. The user interface allows for the customization of filters and provides interactive visualization tools for better data exploration.
Applications: gnomAD is extensively used in population genetics studies, disease association analyses, and variant interpretation for clinical genetics. It serves as a valuable reference dataset for researchers and clinicians seeking to understand the global patterns of genetic variation and identify potentially pathogenic variants in specific populations.
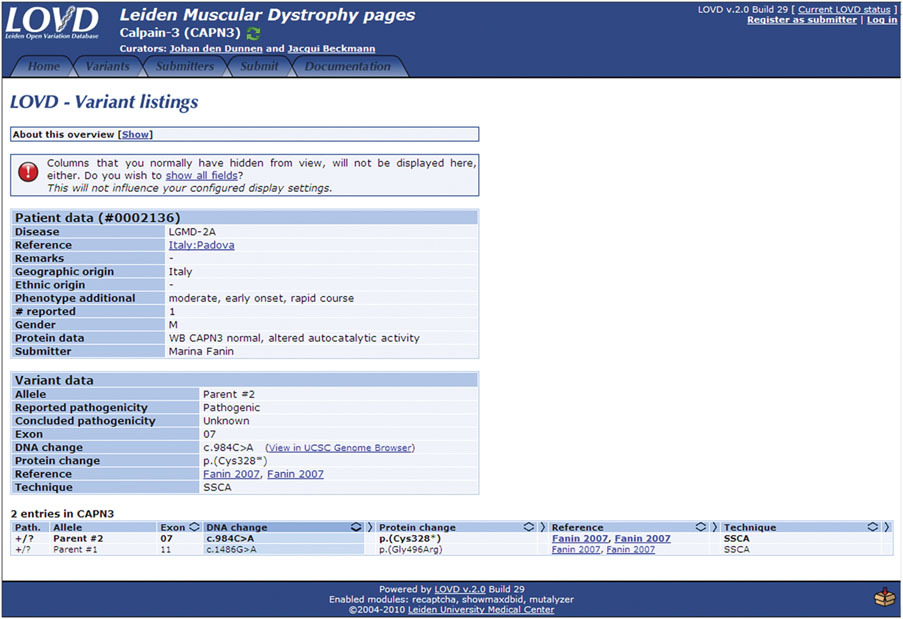
LOVD (Leiden Open Variation Database)
Overview: The Leiden Open Variation Database (LOVD) is a powerful and flexible platform for creating and maintaining locus-specific databases that focus on genetic variants associated with specific diseases, genes, or regions of interest. LOVD enables researchers and clinicians to collaboratively curate and share variant data, making it a community-driven resource.
Locus-Specific Databases: LOVD allows users to build and customize locus-specific databases for specific genetic loci or genes of interest. These databases can be tailored to include curated variant data, genotype-phenotype associations, functional annotations, and relevant clinical information.
Community-Driven Curation: One of the main strengths of LOVD is its community-driven approach to data curation. Researchers, clinicians, and geneticists with expertise in specific diseases or genes can contribute to the database by submitting and curating variant data, enhancing the accuracy and completeness of the information available.
Clinical and Research Utility: LOVD serves as a valuable resource for researchers and clinicians studying rare genetic disorders. It enables the aggregation of variant data from multiple sources, aiding in the identification of recurrent variants, genotype-phenotype correlations, and disease-causing mutations.
Variant Interpretation: LOVD facilitates the interpretation of variants in a clinical context. Clinicians can access curated data on known disease-causing mutations and genetic variations associated with specific phenotypes, improving the accuracy of variant interpretation and supporting personalized medicine efforts.
Data Sharing and Collaboration: LOVD fosters collaboration and data sharing among researchers and clinicians working on similar diseases or genes. The open-access nature of LOVD allows for data exchange and integration with other databases and resources, further promoting knowledge sharing and scientific advancements.
Customization and Privacy: LOVD allows database administrators to customize data access levels, ensuring that sensitive or private patient information is protected and compliant with ethical guidelines. The platform supports controlled access and user permissions, ensuring that the right level of data access is granted to authorized individuals.
Applications: LOVD has been widely used in the study of rare genetic diseases, particularly those with a strong Mendelian inheritance pattern. It serves as an invaluable resource for researchers investigating genotype-phenotype correlations, identifying novel disease-causing variants, and promoting collaboration among the scientific community.
dbNSFP (Database for Non-synonymous Functional Predictions)
Overview: The Database for Non-synonymous Functional Predictions (dbNSFP) is a comprehensive and publicly available database that contains functional predictions for genetic variants, particularly non-synonymous variants (those that alter the amino acid sequence of proteins). dbNSFP consolidates predictions from multiple algorithms, providing a valuable resource for researchers investigating the potential impact of genetic variants on protein function.
Functional Predictions: dbNSFP includes predictions from a wide range of computational tools that assess the functional consequences of genetic variants. These tools utilize various features, such as evolutionary conservation, protein structure, and physicochemical properties, to estimate the potential deleteriousness of non-synonymous variants. By integrating multiple predictions, dbNSFP offers a more comprehensive assessment of variant functional impact.
Variant Annotations: In addition to functional predictions, dbNSFP provides extensive annotations for genetic variants, including information on allele frequencies in different populations, disease associations, and annotations from various variant databases. This wealth of information helps researchers contextualize the functional predictions and prioritize variants for further investigation.
Data Sources: dbNSFP compiles variant data from various publicly available resources, such as the 1000 Genomes Project, ExAC, and gnomAD. By integrating data from multiple sources, dbNSFP ensures that its predictions and annotations are based on a diverse set of variant data, enhancing the reliability and coverage of the database.
Applications: dbNSFP is widely used in genetic variant prioritization, particularly in the context of rare disease research and variant interpretation. Its functional predictions aid in distinguishing between disease-causing variants and benign variants, guiding researchers in identifying potential pathogenic mutations.
GWAS Catalog (Genome-Wide Association Studies Catalog)
Overview: The Genome-Wide Association Studies (GWAS) Catalog is a comprehensive database that consolidates data from a wide range of GWAS studies. It catalogs genetic variants associated with various traits, diseases, and complex phenotypes, providing a valuable resource for understanding the genetic basis of common diseases.
GWAS Meta-Analysis: The GWAS Catalog includes results from meta-analyses of GWAS studies, which combine data from multiple individual studies to increase statistical power and identify robust associations. This meta-analytic approach enables the discovery of genetic variants that have modest effects on phenotypes.
Trait Associations: The database contains associations between genetic variants and a diverse set of traits, including common diseases (e.g., diabetes, cardiovascular diseases), anthropometric measurements, and behavioral traits. The cataloged associations shed light on the genetic architecture underlying complex phenotypes.
Data Accessibility: The GWAS Catalog provides a user-friendly interface that allows researchers to query and access variant-trait associations easily. The database is regularly updated to include new GWAS findings, ensuring that the data remains up-to-date and relevant for ongoing research.
Functional Annotations: While the GWAS Catalog primarily focuses on genetic associations, it also includes functional annotations for some variants when available. These annotations provide insights into the potential functional consequences of associated variants, helping researchers understand the underlying biology of trait associations.
Applications: The GWAS Catalog is a valuable resource for researchers investigating the genetics of complex traits and diseases. It serves as a reference for prioritizing candidate genes and variants in follow-up studies and supports the discovery of novel genetic associations in various human phenotypes.
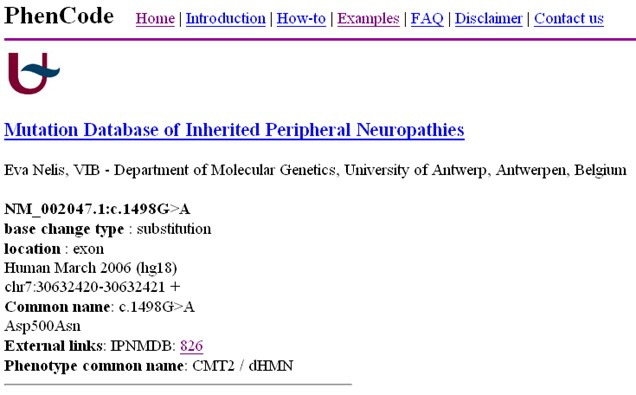
PhenCode
Overview: PhenCode (Phenotypes for ENCODE) is a standardized and controlled vocabulary for describing phenotypes (observable characteristics) associated with genetic variants and human diseases. It was developed to facilitate the accurate and consistent representation of phenotypic information in genetic databases and publications.
Standardized Phenotype Description: PhenCode provides a structured and standardized way to describe phenotypic features associated with genetic variants and diseases. By using standardized terminology, researchers can ensure clarity and consistency when communicating and sharing phenotype information.
Integration with Genetic Data: PhenCode is designed to be integrated with genetic variant databases and tools, allowing for the annotation and classification of variants based on their associated phenotypes. This integration helps researchers and clinicians interpret the functional relevance of genetic variants and their potential contributions to disease.
Ontology and HPO Integration: PhenCode is built on ontological principles, aligning with the Human Phenotype Ontology (HPO) – a standardized and widely used vocabulary for human phenotypes. The integration with HPO enables interoperability and data exchange between different databases and resources.
Collaborative Curation: PhenCode benefits from community-driven curation efforts, allowing researchers and clinicians to contribute to the expansion and refinement of the phenotype description language. This collaborative approach ensures that the vocabulary remains up-to-date and reflects the latest knowledge in the field.
Applications: PhenCode plays a crucial role in the annotation and interpretation of genetic variants in both research and clinical settings. By providing standardized and computable phenotype descriptions, PhenCode facilitates variant interpretation, clinical diagnosis, and the discovery of genotype-phenotype correlations.
VARIANT ANNOTATION TOOLS
Among the widely used annotation tools are ANNOVAR, VEP, snpEff, and SeattleSeq. ANNOVAR is a versatile command-line tool that annotates SNPs, INDELs, and CNVs, aiding in the identification of rare variants linked to Mendelian diseases. VEP, on the other hand, offers a user-friendly web-based interface and supports a wide range of input file formats for annotating SNPs, INDELs, CNVs, or SVs. Although annotation tools simplify the interpretation process, challenges arise due to alternative splicing, inconsistencies in reference datasets, and variations in annotation methodologies, demanding a cautious analysis that integrates data from multiple sources. A more comprehensive description of each and more are presented as follows:
ANNOVAR
Overview: ANNOVAR (Annotate Variation) is a widely used and versatile software tool for variant annotation and functional interpretation. It aids researchers and clinicians in comprehensively annotating genetic variants identified from Next-Generation Sequencing (NGS) data, helping to uncover potential functional implications of these variants in the context of genes and genomic elements.
Variant Annotation: ANNOVAR takes Variant Call Format (VCF) files as input and annotates variants with diverse information, including genomic location, functional consequences (e.g., missense, nonsense, frameshift), allele frequencies in various populations, evolutionary conservation scores, and disease association data from databases like ClinVar and HGMD.
Custom Annotation: One of ANNOVAR’s strengths lies in its flexibility, allowing users to incorporate custom annotation data, such as gene-based functional scores or phenotype-specific annotations. Researchers can easily integrate additional information relevant to their specific study to enhance variant interpretation.
Population Frequency Filters: ANNOVAR enables filtering variants based on allele frequencies in different population databases, such as the 1000 Genomes Project and gnomAD. This feature assists in prioritizing rare variants, which are often more relevant for the study of Mendelian diseases.
Limitations: ANNOVAR’s command-line interface might be challenging for inexperienced users, and its reliance on specific genomic databases may result in some variants being missed if they are not present in the chosen databases. Nevertheless, ANNOVAR remains a powerful and widely adopted tool for variant annotation and prioritization in research and clinical settings.
VEP (Variant Effect Predictor)
Overview: Variant Effect Predictor (VEP) is a popular and user-friendly tool developed by Ensembl (EMBL-EBI) for annotating and predicting the functional consequences of genetic variants. VEP is accessible through a web-based interface, a standalone Perl script, or a REST API, making it easily accessible to researchers with diverse levels of bioinformatics expertise.
Comprehensive Annotation: VEP provides a wide range of annotations, including variant consequences (e.g., missense, frameshift, splice site), impact predictions based on gene annotations, known variants in various databases (e.g., dbSNP), and allele frequencies in population databases (e.g., gnomAD).
Transcript Choice and Splicing Prediction: VEP accounts for alternative splicing and different transcript isoforms, allowing users to select the most relevant transcript for variant annotation. It also incorporates splicing prediction algorithms to identify variants potentially affecting splicing.
Species-Specific Annotation: VEP can be used for variant annotation in various species, not limited to humans. It supports annotation for a wide range of organisms, making it valuable for researchers working with diverse model organisms.
Limitations: While VEP offers a user-friendly interface, it requires internet access for web-based usage, which might be inconvenient for users with restricted connectivity. Additionally, the annotation output may lack certain custom annotations that other tools like ANNOVAR allow.
snpEff
Overview: snpEff is an efficient and widely used tool for variant annotation and prediction of variant effects on genes and transcripts. Developed by Pablo Cingolani, it is command-line based and can be integrated into various analysis pipelines.
Variant Annotation and Prediction: snpEff annotates variants with comprehensive information, including variant impact on genes and transcripts (e.g., missense, stop-gained, splice site), protein consequences, and functional classification (e.g., synonymous, non-synonymous).
Customizable Databases: snpEff allows users to create custom databases, facilitating the annotation of variants specific to their study organisms or populations. Researchers can use existing reference genomes or build their own for improved accuracy and relevance.
Rapid and Scalable: snpEff is known for its speed and efficiency, making it suitable for analyzing large-scale NGS data. It can handle whole-genome, exome, and targeted sequencing data, making it valuable for various genomic studies.
Limitations: snpEff’s command-line interface may be less intuitive for non-technical users compared to web-based tools. While it excels in predicting variant effects on genes and transcripts, it may not offer some additional annotations available in other tools like ANNOVAR or VEP.
SeattleSeq
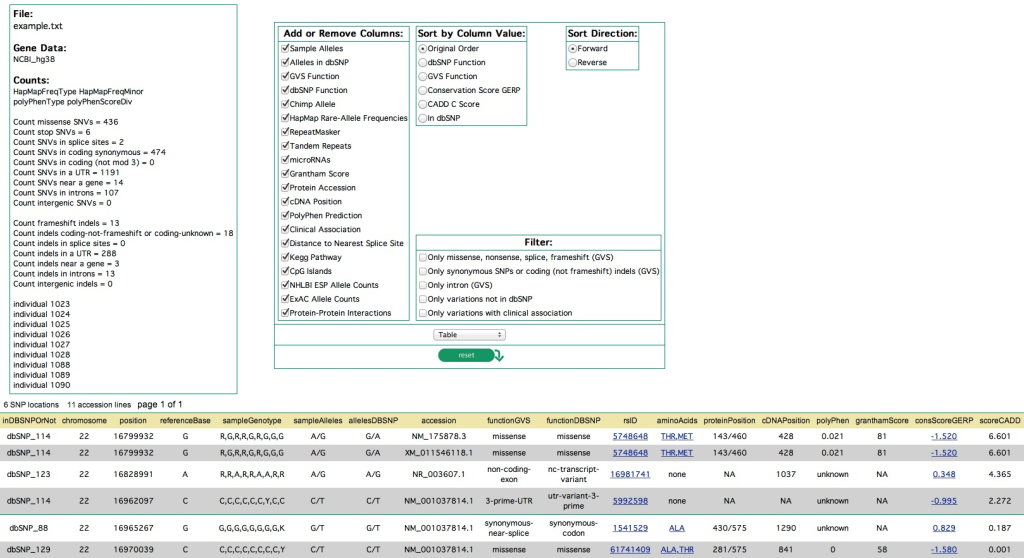
Overview: SeattleSeq, developed at the University of Washington, is a comprehensive and user-friendly tool for the annotation and interpretation of genetic variants from NGS data. It aims to assist researchers and clinicians in understanding the potential functional implications of genetic variants in individual genomes.
Variant Annotation and Predictions: SeattleSeq provides extensive variant annotations, including variant impact on genes, amino acid changes, potential splice site alterations, and information about variants present in various databases (e.g., dbSNP, 1000 Genomes Project).
Functional Scores: SeattleSeq incorporates functional scores from various algorithms, such as SIFT and PolyPhen-2, to predict the potential deleteriousness of missense variants. These scores aid in prioritizing variants for further investigation.
Gene-Based Prioritization: SeattleSeq allows gene-based prioritization, helping researchers focus on specific genes that might be relevant to the phenotype under study. This feature is especially valuable for identifying disease-causing variants in the context of rare Mendelian disorders.
Limitations: While SeattleSeq offers a user-friendly interface, its updates and maintenance might not be as frequent as other tools like ANNOVAR or VEP. Users might need to cross-validate their annotations with other databases or tools for comprehensive variant interpretation.
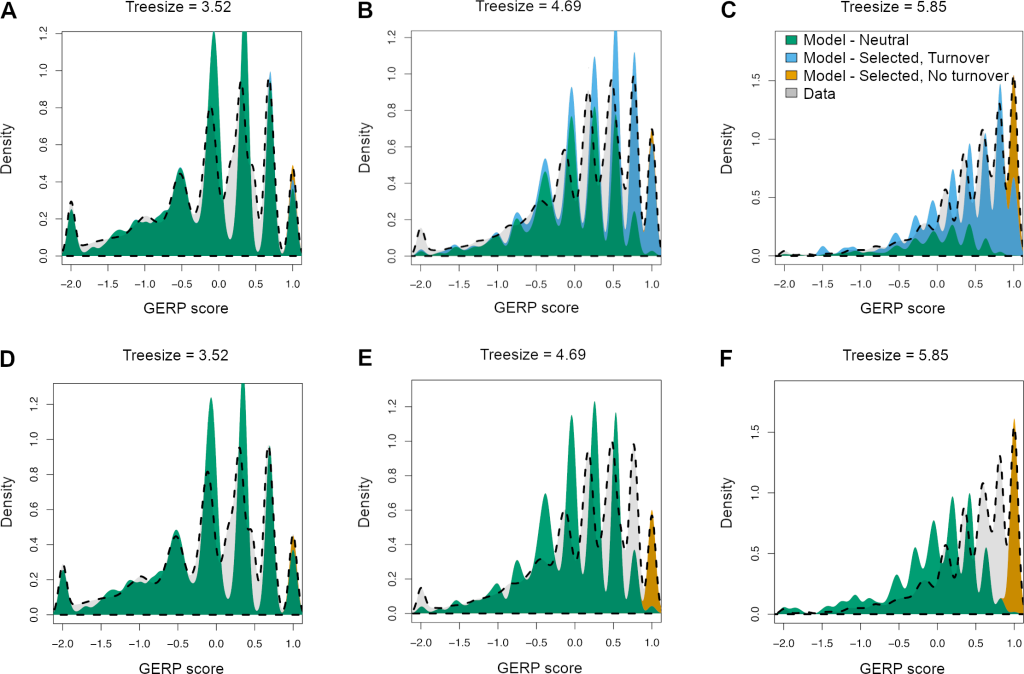
Conservation Score (GERP)
Overview: The GERP (Genomic Evolutionary Rate Profiling) conservation score is a widely used annotation that measures the evolutionary constraint on nucleotide positions across multiple species. It quantifies the degree of conservation of a given genomic position based on the idea that conserved regions are likely to be functionally important and less tolerant to genetic variation.
Calculation and Interpretation: GERP scores are computed by comparing the sequence alignment of orthologous genomic regions in multiple species. Higher GERP scores indicate greater conservation, suggesting that a genomic position is evolutionarily conserved and potentially functionally important. In contrast, lower or negative GERP scores suggest less conservation and tolerance to variation.
Biological Significance: GERP scores are essential for prioritizing potentially deleterious variants, especially in non-coding regions where functional annotations are limited. High GERP scores can help identify regulatory elements or functional non-coding RNAs that are crucial for gene regulation and expression.
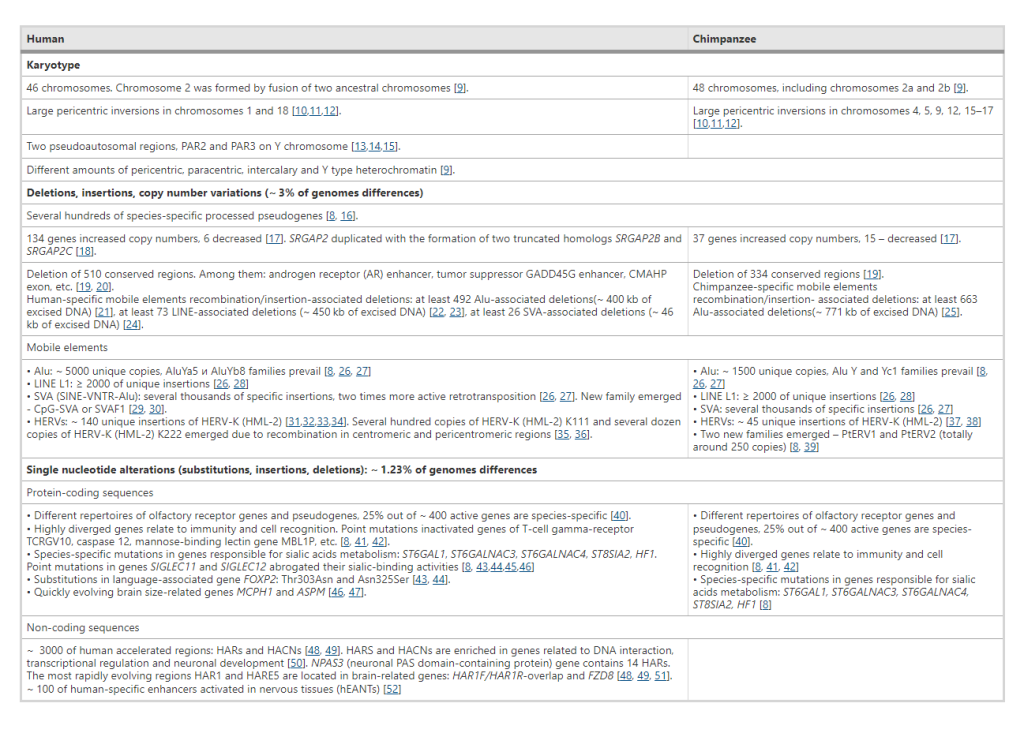
Chimp Allele
Overview: Chimp allele annotation indicates the allele observed in chimpanzees at a particular genomic position. It is often included in variant annotations to provide additional information about the genetic diversity in the hominid lineage.
Interpretation: The chimp allele provides insights into the ancestral state of a genomic position, helping researchers infer the evolutionary history and divergence of human populations from other primates. It also aids in identifying genomic regions that have undergone positive selection or experienced adaptive evolution.
Biological Significance: Chimp allele information contributes to understanding the genetic basis of human evolution, providing valuable context for studying human population genetics and identifying regions with potential functional significance.
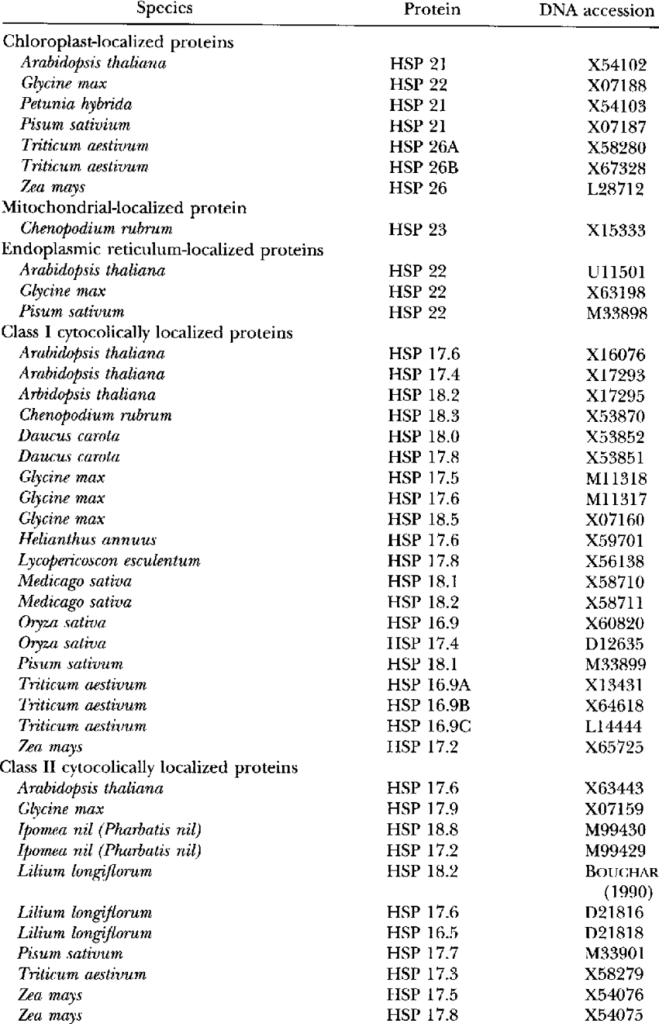
Protein Accession
Overview: Protein accession refers to the unique identifier assigned to a protein sequence in a protein database, such as UniProt or RefSeq. Protein accessions are often included in variant annotations to link genetic variations to their potential impact on protein sequences.
Interpretation: By providing the protein accession, researchers can directly access detailed information about the corresponding protein, such as its length, function, domain architecture, and known disease associations.
Biological Significance: Protein accessions aid in prioritizing missense variants that might affect protein structure or function, and they support genotype-phenotype correlation studies, particularly for genetic diseases with established associations.
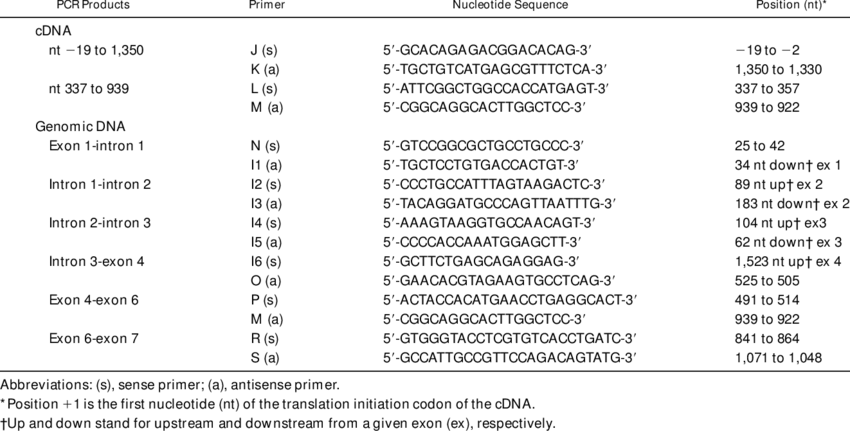
cDNA Position
Overview: cDNA position indicates the position of a variant within the corresponding cDNA sequence, representing the mature mRNA transcript after splicing and intron removal. This annotation is essential for understanding the impact of variants on the final transcript.
Interpretation: cDNA positions help identify whether a variant occurs in coding or non-coding regions of a gene and whether it affects protein-coding sequences or splice sites.
Biological Significance: cDNA position information is critical for prioritizing variants that affect protein-coding regions (exons) and for predicting potential alterations in protein function due to missense mutations or frameshifts.
Clinical Association
Overview: Clinical association annotations indicate whether a genetic variant has been previously reported in association with specific human diseases or conditions.
Interpretation: Variants with known clinical associations can be critical for understanding disease etiology and pathogenic mechanisms. Such annotations support the identification of disease-causing variants and assist in genetic diagnosis and patient management.
Biological Significance: Clinical association annotations are of paramount importance in clinical genomics and personalized medicine, providing clinicians with valuable information for patient care and treatment decisions.
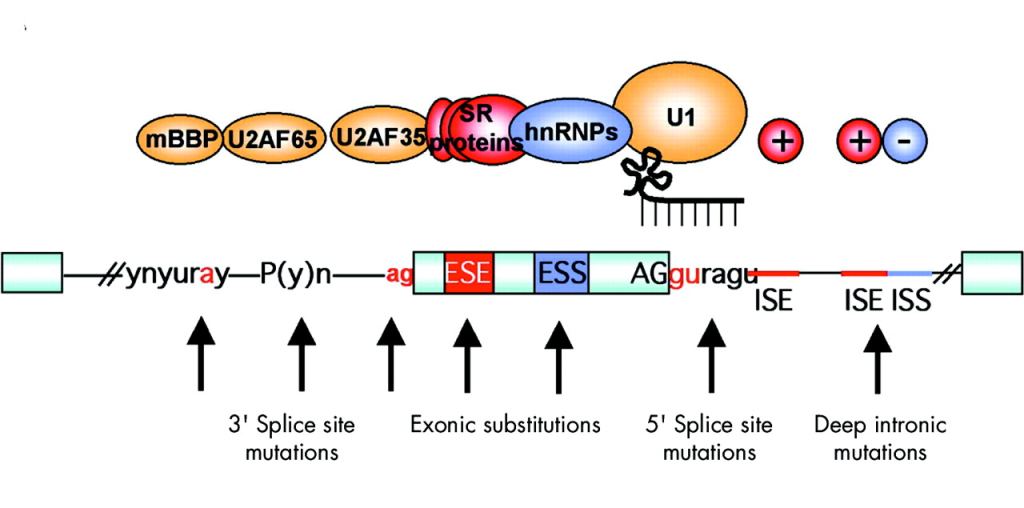
Distance to Nearest Splice Site
Overview: The distance to the nearest splice site annotation indicates the genomic distance between a variant and the closest exon-intron junction, typically measured in nucleotides.
Interpretation: Variants located close to splice sites may potentially impact mRNA splicing, leading to aberrant transcript isoforms and protein products.
Biological Significance: This annotation is crucial for identifying splice site variants that may cause genetic diseases through abnormal splicing and for understanding the molecular consequences of such variants.
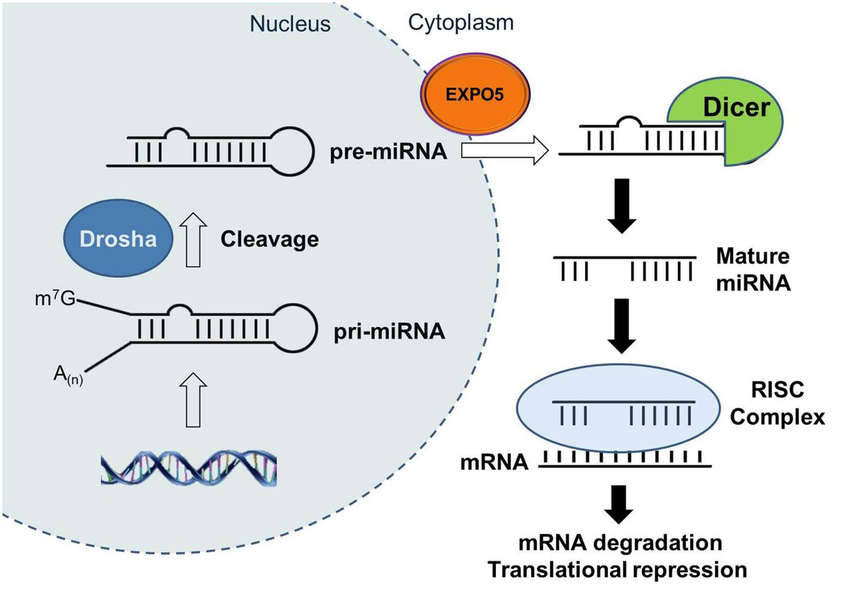
microRNAs
Overview: microRNAs (miRNAs) are small non-coding RNAs that regulate gene expression post-transcriptionally. Annotations for microRNAs in genomic regions indicate their potential interactions with genetic variants.
Interpretation: Variants located within or near microRNA binding sites can potentially disrupt miRNA-mRNA interactions, affecting gene expression regulation.
Biological Significance: Understanding the influence of variants on miRNA-mediated regulation is important for elucidating the molecular basis of complex traits and diseases.
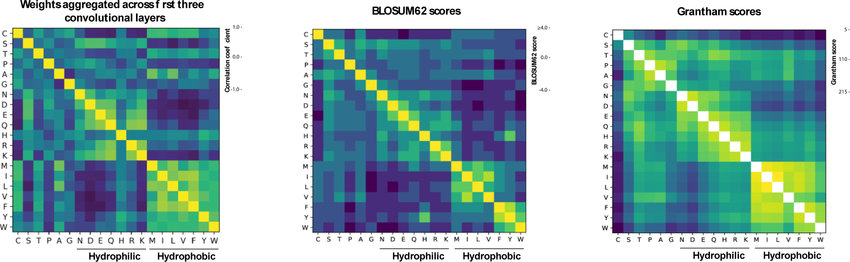
Grantham Score
Overview: The Grantham score is a numerical measure of amino acid substitution similarity, reflecting the physicochemical differences between two amino acids.
Calculation and Interpretation: Grantham scores are computed based on properties such as side-chain composition, polarity, and molecular volume of the substituted amino acids. Higher scores indicate more radical substitutions, while lower scores represent conservative changes.
Biological Significance: Grantham scores help assess the potential impact of missense variants on protein structure and function. High scores suggest more drastic alterations that might lead to significant functional changes.
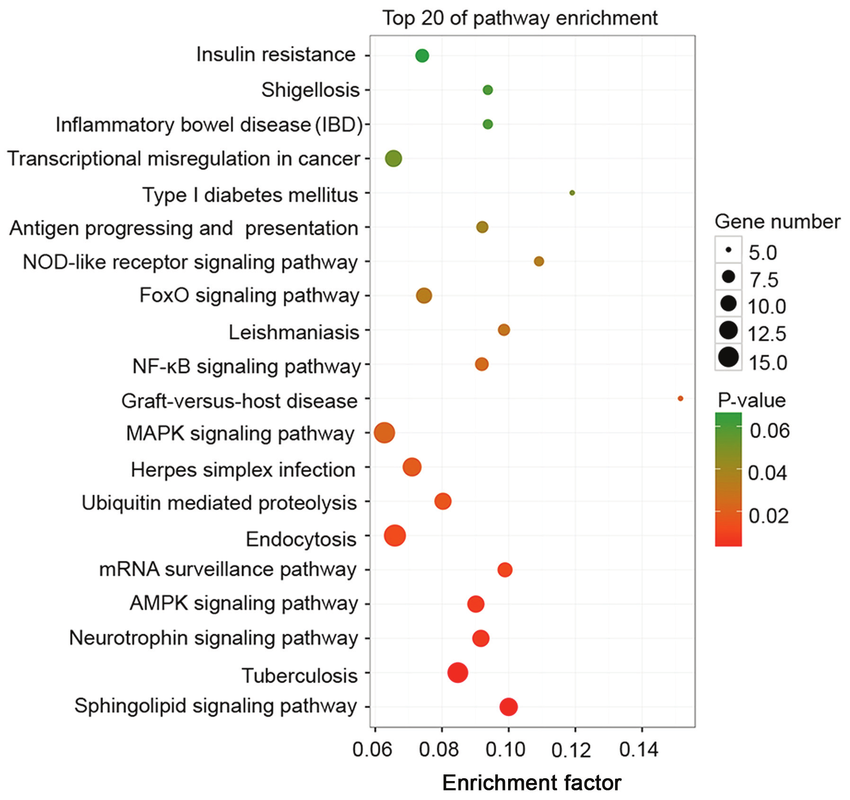
KEGG Pathways
Overview: The KEGG (Kyoto Encyclopedia of Genes and Genomes) Pathways annotation provides information about the involvement of genes or variants in specific biological pathways.
Interpretation: Variants associated with genes participating in critical pathways can offer insights into the molecular mechanisms underlying disease etiology and pathogenesis.
Biological Significance: KEGG pathway annotations facilitate the interpretation of genetic variants in the context of biological processes and can uncover potential therapeutic targets and disease mechanisms.
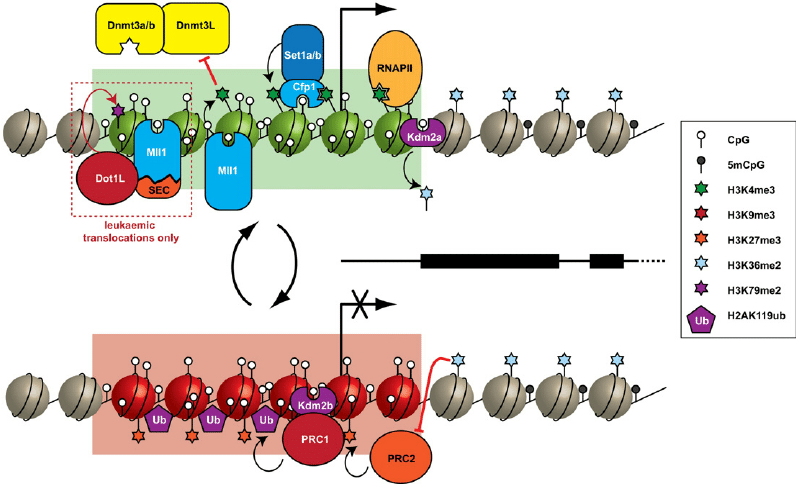
CpG Islands
Overview: CpG islands are regions in the genome with a high frequency of CpG dinucleotides. These regions are often associated with gene promoters and play a role in gene regulation.
Interpretation: Variants located in or near CpG islands may impact transcriptional regulation, potentially affecting gene expression.
Biological Significance: Understanding the impact of variants in CpG islands can provide insights into regulatory processes and the regulation of gene expression.
Protein-Protein Interactions
Overview: Protein-protein interaction annotations indicate the potential interactions between the protein product of a gene affected by a variant and other proteins in the cellular context.
Interpretation: Variants that disrupt protein-protein interactions may interfere with crucial cellular processes and pathways.
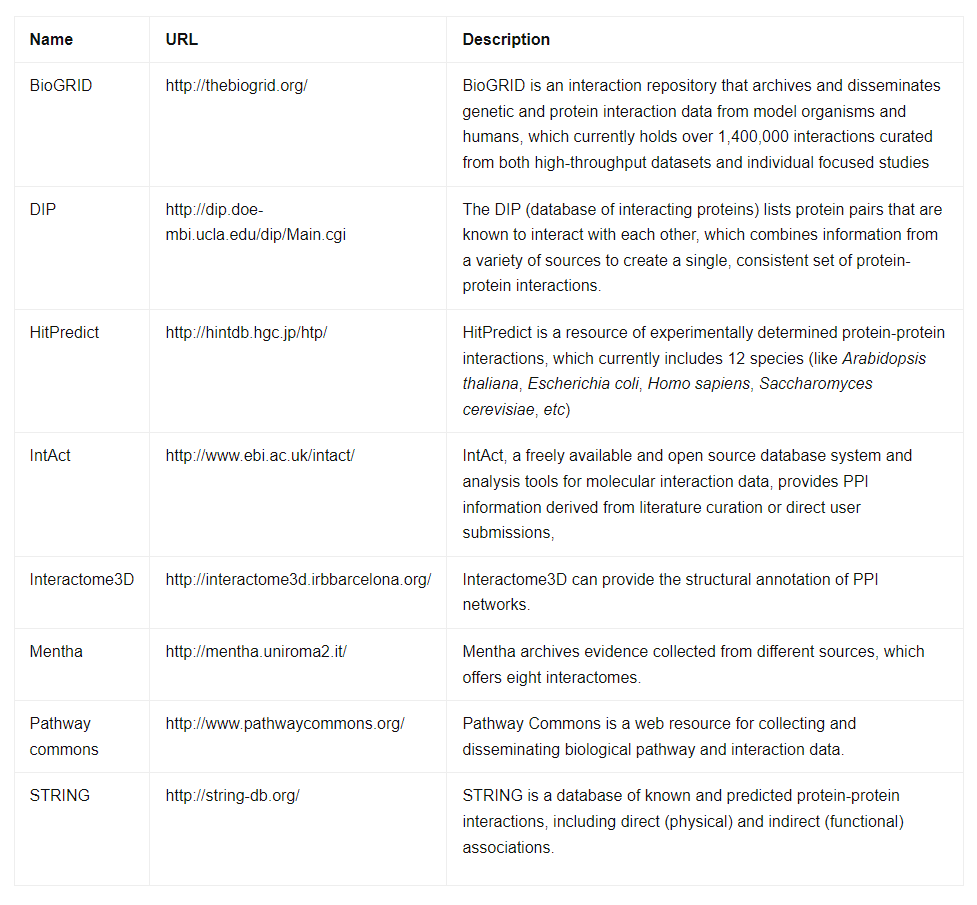
Biological Significance: Annotations related to protein-protein interactions can highlight variants that impact cellular signaling and molecular networks, aiding in the identification of disease-associated variants and potential drug targets.
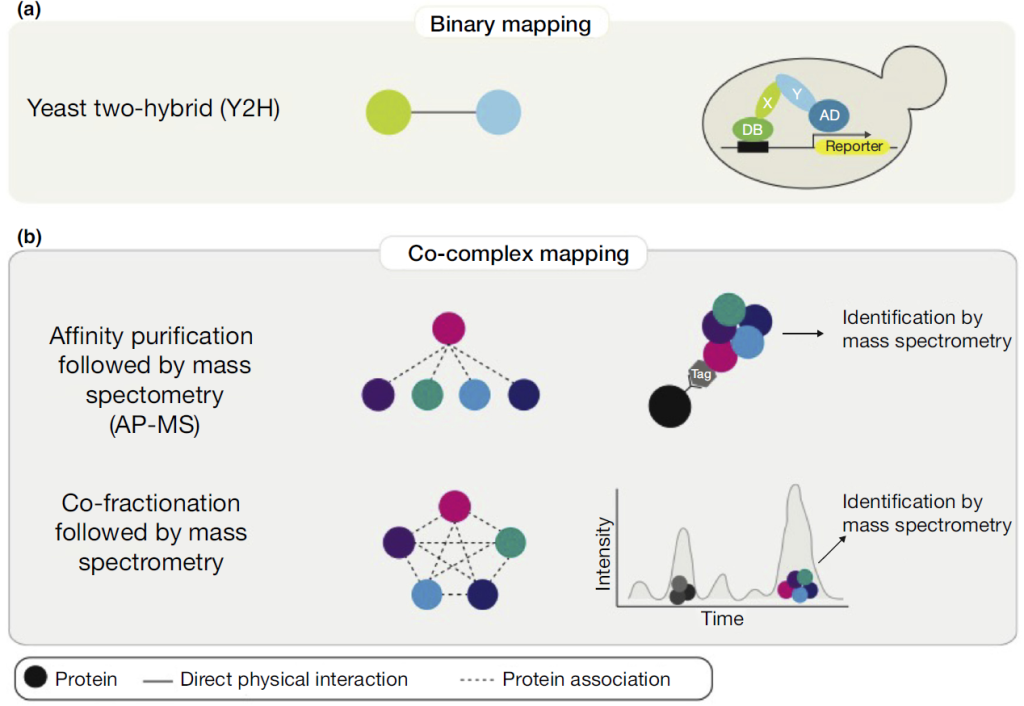
Protein-protein interactions produce a vast amount of experimental data, necessitating the creation of computer-readable biological databases for data organization and processing. Below, we present a table featuring well-known protein-protein interaction databases frequently used in research.
Complexities of Variant Annotation: From Alternative Splicing to Overlapping Genes
The seemingly straightforward process of variant annotation becomes a challenging endeavor when considering the intricacies of genetic organization. Alternative splicing, a process where a single gene can produce multiple transcripts and, consequently, different proteins, contributes to the diversity of the transcriptome and proteome. This diversity enriches genetic variation but also adds complexity to variant annotation.
Moreover, the use of different databases and reference genomes datasets introduces variability to NGS data analysis. Databases like Ensembl, RefSeq, and UCSC Genome Browser offer valuable reference datasets, but differences in their content and representation of gene transcripts can lead to discrepant annotations. To address these limitations, projects like the collaborative consensus coding sequence (CCDS) aim to provide standardized representations of identical protein annotations across various databases. To mitigate challenges related to multiple transcripts and annotation tools, researchers must interpret variant annotations in the context of the research problem and, ideally, cross-reference data from multiple sources.
REFERENCE DATASETS
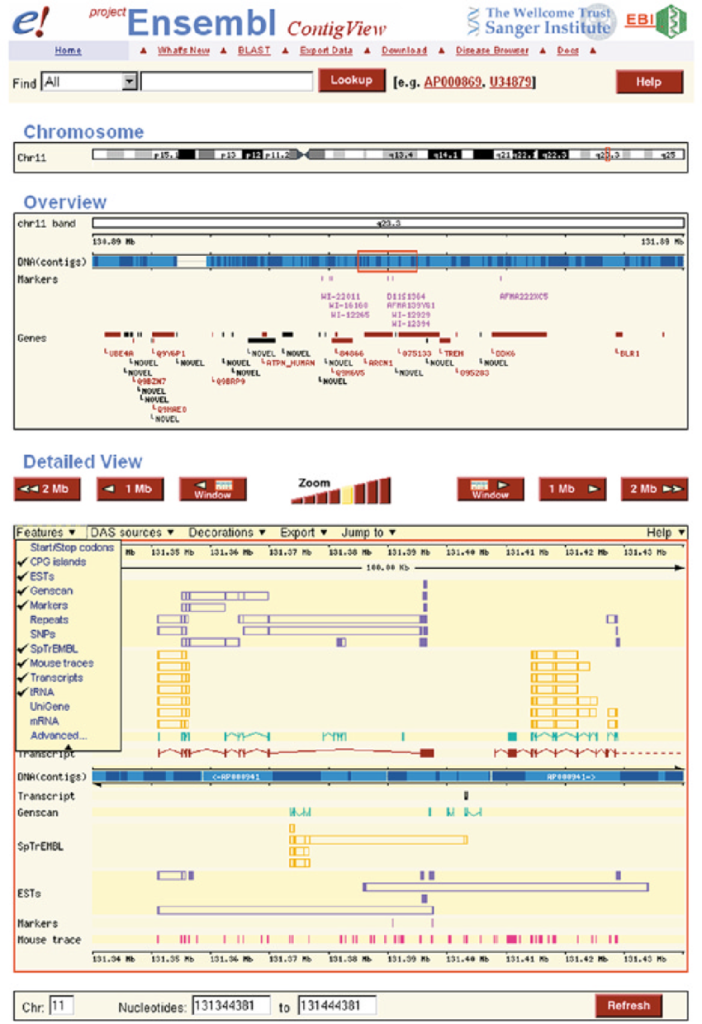
Ensembl
Overview: Ensembl is a comprehensive genome annotation database and web-based browser that provides a wealth of genomic information for various species, including human, mouse, and many others. It is a collaborative project developed and maintained by the European Bioinformatics Institute (EMBL-EBI) and the Wellcome Sanger Institute.
Features and Content: Ensembl integrates multiple sources of genomic data, including gene annotations, transcripts, protein sequences, regulatory elements, genetic variations, comparative genomics, and functional annotations. It provides a user-friendly interface to explore and visualize genomic data, making it an invaluable resource for researchers and clinicians alike.
Gene Annotation: Ensembl’s gene annotations include information about gene structure, coding sequences, alternative transcripts, and functional annotations. It also provides details on gene function, biological pathways, and known disease associations.
Variation and Phenotype Data: Ensembl incorporates variant data from various sources, including dbSNP and 1000 Genomes Project, along with functional predictions. It offers a comprehensive view of genetic variations and their potential impact on protein function and disease.
Comparative Genomics: Ensembl offers comparative genomics tools that allow researchers to compare gene sequences and annotations across multiple species, facilitating the study of evolutionary relationships and identifying conserved elements.
Regulatory Elements: Ensembl provides information on transcription factor binding sites, enhancers, and other regulatory elements, aiding in the understanding of gene regulation.
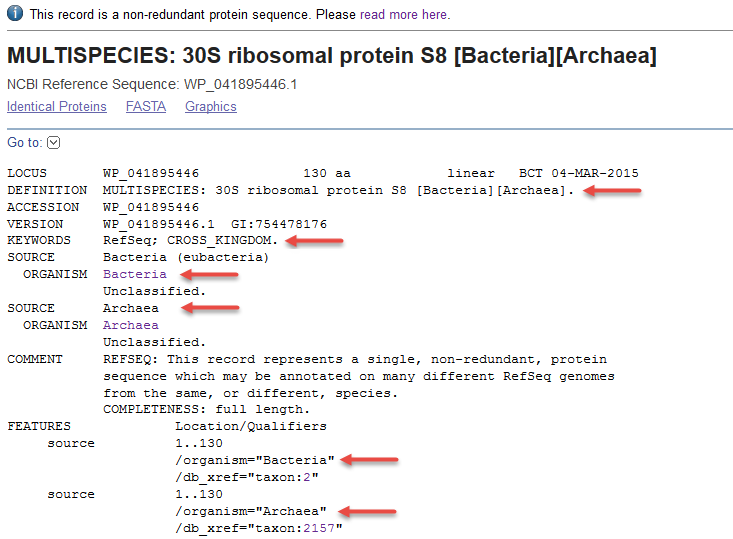
RefSeq
Overview: RefSeq (Reference Sequence) is a curated, comprehensive, and non-redundant database developed and maintained by the National Center for Biotechnology Information (NCBI). It serves as a primary reference for gene annotations and transcript sequences.
Features and Content: RefSeq provides well-annotated reference sequences for genes, transcripts, proteins, and non-coding RNAs for a wide range of organisms, including human, mouse, and model organisms.
Gene Annotation: RefSeq gene annotations include curated information on exon-intron structures, coding sequences, and functional annotations. It aims to provide a standardized and high-quality representation of genomic features.
Transcript Variants: RefSeq includes multiple transcript variants for each gene, reflecting the complexity of alternative splicing and transcription start sites.
Protein Sequences: RefSeq provides curated and annotated protein sequences, facilitating protein structure and functional analysis.
Gene Families and Homologs: RefSeq categorizes genes into families based on sequence similarity and functional annotations, aiding in comparative genomics and evolutionary studies.
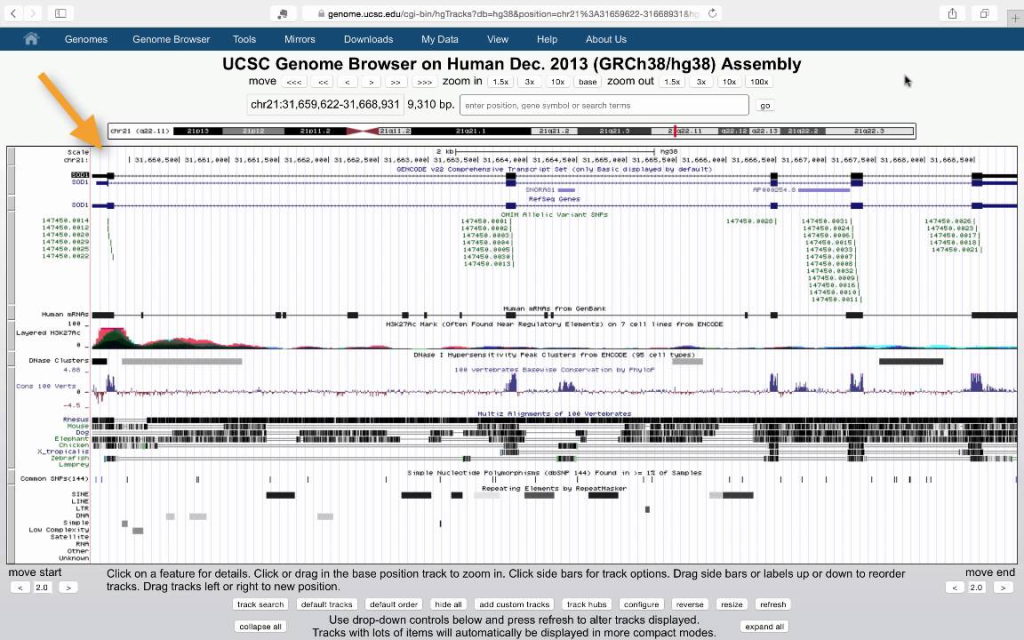
UCSC Genome Browser
Overview: The UCSC Genome Browser is a widely used web-based genome browser developed and maintained by the University of California, Santa Cruz (UCSC). It provides an interactive platform for visualizing and exploring genomic data.
Features and Content: The UCSC Genome Browser integrates diverse genomic data from various sources, including genome assemblies, gene annotations, genetic variations, epigenetic marks, and comparative genomics data.
Genome Assemblies: The UCSC Genome Browser hosts multiple genome assemblies for numerous species, ranging from reference genomes to alternative assemblies and draft sequences.
Gene Annotation: UCSC Genome Browser provides gene annotations with information on exon-intron structures, coding sequences, and functional annotations.
Genetic Variations: The browser includes information from dbSNP and other variation databases, along with functional predictions for variants.
Epigenetic Data: UCSC Genome Browser incorporates epigenetic data, such as DNA methylation and histone modifications, providing insights into gene regulation and chromatin states.
Comparative Genomics: The browser offers a range of tools for comparative genomics, allowing researchers to visualize evolutionary relationships and conservation across species.
Track Customization: UCSC Genome Browser allows users to upload and visualize their own data, enabling researchers to integrate and analyze their experimental data within the context of the reference genome.
COLLABORATIVE CONSENSUS CODING SEQUENCE
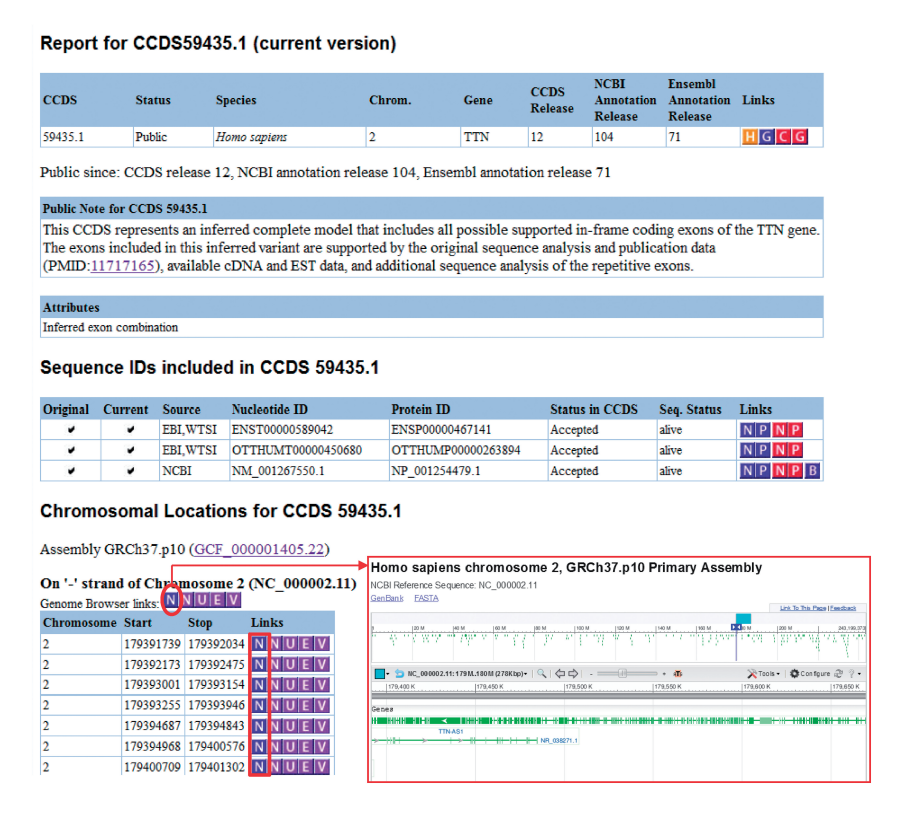
The Collaborative Consensus Coding Sequence (CCDS) project is a collaborative effort among major genome annotation centers to produce a standardized and well-curated set of coding regions for humans and select model organisms. The primary goal of CCDS is to provide a consensus representation of protein-coding genes, ensuring consistent and reliable annotations across different databases and genome assemblies.
The CCDS project was initiated in 2007 by three major genome annotation centers: the National Center for Biotechnology Information (NCBI), the European Bioinformatics Institute (EMBL-EBI), and the Wellcome Trust Sanger Institute. Since then, other organizations, including the University of California, Santa Cruz (UCSC), and Ensembl, have joined the consortium. The project aims to overcome discrepancies and inconsistencies in coding region annotations, which can arise due to differences in annotation pipelines and data sources.
The CCDS consortium works collaboratively to identify and curate a set of coding regions that have strong experimental evidence and broad agreement among multiple annotation resources. The process involves careful manual curation, incorporating data from experimental evidence, such as full-length cDNA sequences, RNA-seq data, and protein structures. The curated coding sequences are cross-referenced with various databases and resources to ensure their accuracy and relevance.
The CCDS database provides a single, non-redundant set of consensus coding sequences for human and several model organisms, including mouse, zebrafish, and fruit fly. Each CCDS entry represents a coding region with consistent start and stop codons and accurate splice sites. The CCDS database is updated regularly to incorporate new information and improve annotations based on the latest research findings.
Benefits and Significance of the CCDS
Standardization of Annotations: CCDS provides a unified and standardized set of coding sequences, ensuring consistent annotations across various genome databases and tools. Researchers can rely on CCDS annotations for accurate and reliable information about protein-coding genes.
Reduction of Redundancy: The non-redundant nature of CCDS reduces duplication of coding sequence annotations, simplifying data analysis and minimizing potential errors caused by inconsistent annotations.
Facilitating Data Integration: CCDS allows seamless integration of genomic data from different sources and platforms, enabling researchers to cross-validate findings and share results more effectively.
Quality Control and Accuracy: The rigorous curation process employed by CCDS ensures that only well-supported and experimentally verified coding sequences are included, enhancing the accuracy and reliability of gene annotations.
Supporting Genomic Research: CCDS is a valuable resource for researchers involved in genomics, functional genomics, and disease studies. The consensus coding sequences provide a solid foundation for identifying disease-related variants and understanding the molecular basis of genetic disorders.
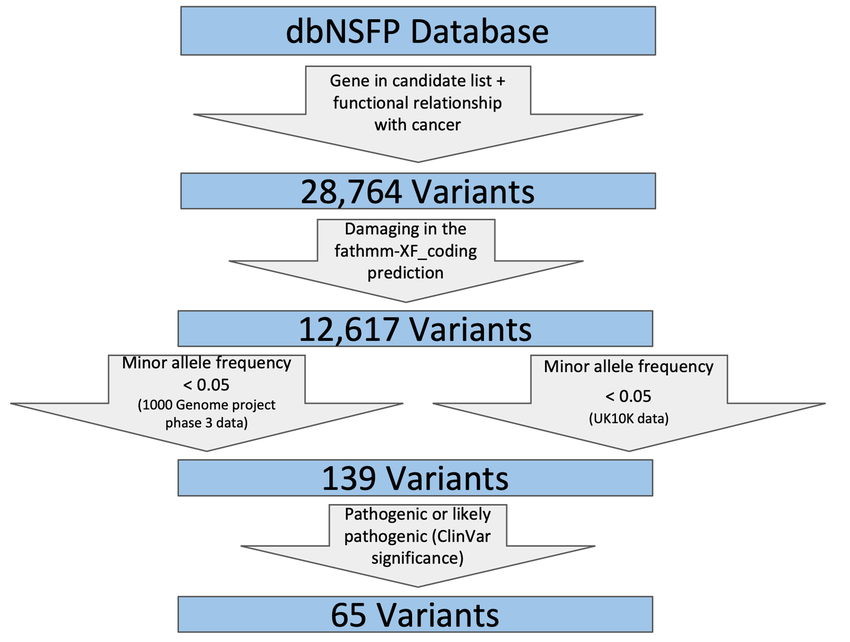
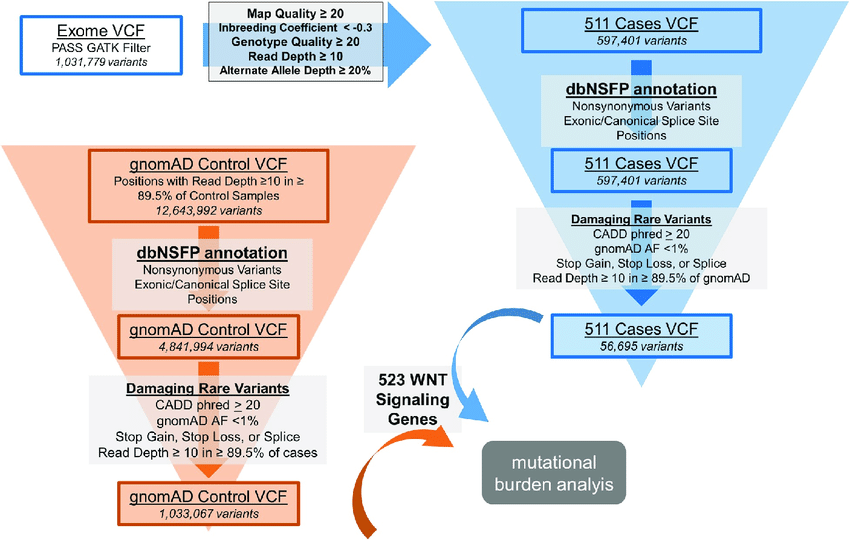
Variant Filtering, Prioritization, and Visualization: Navigating through the Variant Sea
Following variant annotation, the total number of variants may still range in the tens of thousands, necessitating strategic filtering to identify disease-causing variants accurately. Quality parameters, population frequency filters, and functional annotations play pivotal roles in narrowing the list of variants to those with potential clinical significance.
Population frequency filters rely on minor allele frequency (MAF) data from large-scale databases like the 1000 Genome Project, ExAC, and gnomAD. By classifying variants into rare, low frequent, and common categories, these filters help prioritize variants based on their prevalence in human populations.
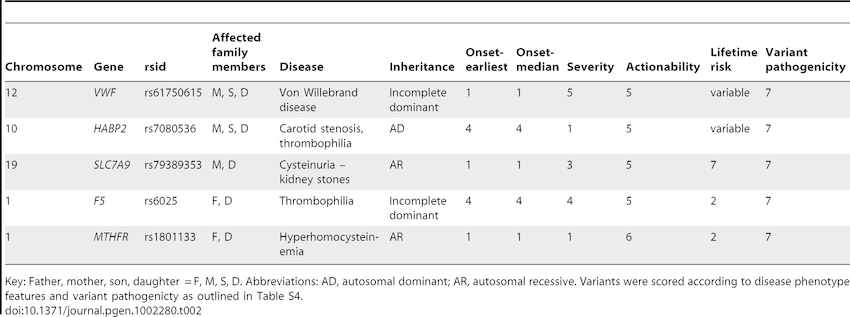
In family-based studies, inheritance-based model filtering assists in reducing the number of variants by focusing on shared heterozygous or homozygous variants in affected individuals. Additionally, functional filters based on predicted impact on protein structure and interactions can further prioritize variants for validation.
VARIANT FILTRATION
Variant filtration is a critical step in the analysis of Next-Generation Sequencing (NGS) data, specifically aimed at reducing the number of false-positive variants and identifying potentially relevant variants for further investigation. This process involves applying various filtering criteria to prioritize and retain variants that are more likely to be biologically significant.
Importance of Variant Filtration
Elimination of False-Positive Variants. NGS data can contain technical artifacts, sequencing errors, and other noise, leading to false-positive variant calls. Filtration helps remove these erroneous variants, increasing the accuracy and reliability of downstream analysis.
Identification of Disease-Causing Variants. In clinical settings and genetic research, variant filtration aims to identify variants that may contribute to the observed phenotype or disease condition.
Focus on Relevant Variants. Filtering enables researchers to concentrate on a smaller subset of variants, facilitating the identification of rare or pathogenic variants.
FILTERING STRATEGIES, STRINGENCY & MULTIPLE FILTER INTEGRATION
The choice of filtering criteria and their stringency depends on the specific research question, the type of study (e.g., clinical diagnosis, rare variant analysis, GWAS), and the available knowledge about the disease or phenotype under investigation. A more stringent filtering approach may reduce false positives but may also lead to the omission of potentially relevant variants.
Often, multiple filtering criteria are combined to assign a ranking or a score to each variant. The integration of multiple filters allows researchers to prioritize variants based on a combination of factors, increasing confidence in identifying relevant variants.
Challenges in Variant Filtration
Optimal Criteria Selection: Selecting the appropriate filtering criteria and setting their thresholds can be challenging, as it requires balancing sensitivity and specificity.
Population-Specific Variation: Variants that are rare in one population may be common in another, necessitating population-specific filtering.
Functional Validation: Filtering based solely on predicted functional impact may require experimental validation to confirm variant pathogenicity.
VARIANT PRIORITIZATION
Variant prioritization involves the systematic assessment and ranking of genetic variants to identify potentially pathogenic or disease-causing variants among a large number of genomic variations.
Importance of Variant Prioritization
Reducing Data Complexity: NGS data often generates a vast number of genetic variants. Variant prioritization helps narrow down the list of variants for further investigation, reducing the complexity of data analysis.
Identification of Disease-Causing Variants: In clinical settings and disease research, variant prioritization aims to identify variants that are likely to contribute to the disease phenotype or condition of interest.
Personalized Medicine: Prioritizing variants allows for personalized medicine, where specific genetic variations can be linked to targeted therapies and treatment decisions.
Understanding Disease Mechanisms: By focusing on the most relevant variants, researchers can gain insights into the molecular mechanisms underlying diseases and traits.
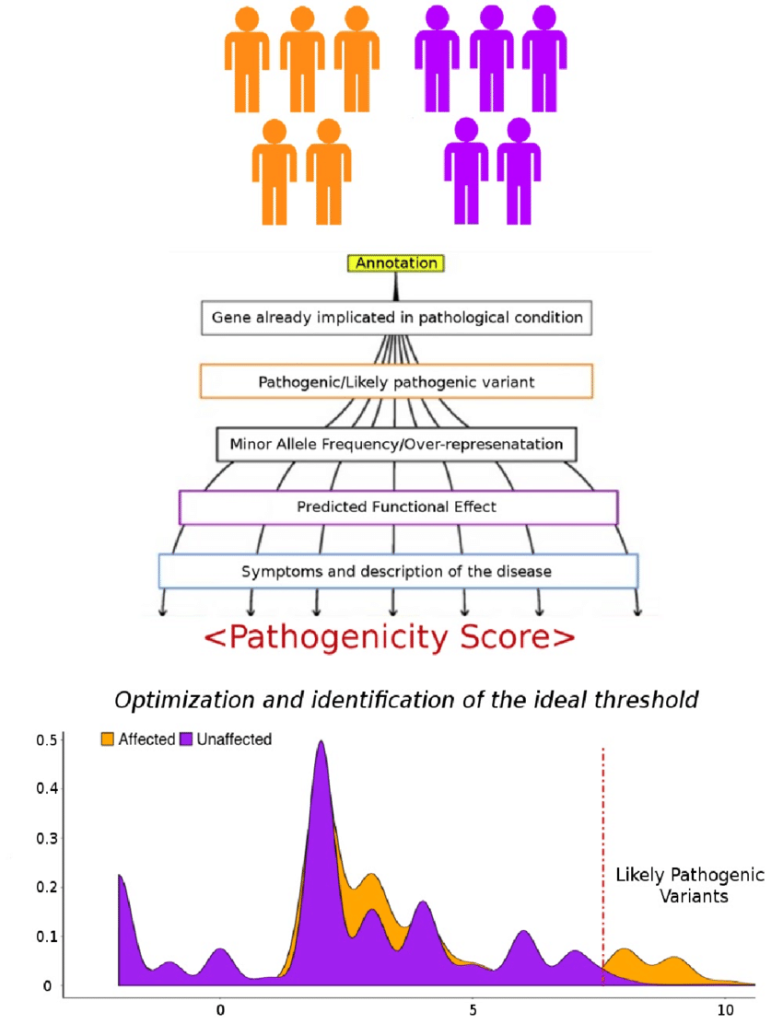
INTEGRATION OF MULTIPLE CRITERIA
In practice, variant prioritization often involves the integration of multiple criteria to assign a ranking or a score to each variant. This integrative approach helps prioritize variants based on a combination of factors, increasing the confidence in identifying potential disease-causing variants.
Challenges in Variant Prioritization
Vast Data Volume: NGS data generates a large number of variants, making it challenging to manage and prioritize efficiently.
Variant Classification: Determining the clinical significance of variants can be complex, especially for variants with uncertain clinical relevance.
Functional Validation: Experimental validation of variant pathogenicity may not always be feasible due to limited resources or complex genetic interactions.
APPROACHES TO VARIANT FILTRATION & PRIORITIZATION
Quality Filters
Read Depth (Coverage): Variants with low read depth may indicate regions with inadequate sequencing coverage, making the variant less reliable.
Base Quality Score: Variants supported by low-quality base calls may be filtered out as they could be erroneous.
Frequency Filters
Rare Variant Analysis: Variants with low allele frequencies in population databases, such as gnomAD, may be prioritized as potential disease-causing variants.
Population-Specific Filters: Variants with a higher frequency in specific populations or ethnic groups may be filtered out if they are likely benign polymorphisms.
Functional Impact Filters
Annotation-Based Filtering: Variants with predicted functional consequences, such as missense, nonsense, splice-site disruptions, frameshifts, etc., are prioritized.
Conservation Scores: Variants occurring in evolutionarily conserved regions are more likely to be functionally significant and may be retained.
Inheritance Pattern Filters
Mendelian Inheritance: In family-based studies, variants consistent with the inheritance pattern of the disease may be prioritized.
De Novo Variants: Variants occurring de novo in the affected individual may be considered more likely to be causative in sporadic cases.
Clinical Association Filters
Variants reported in databases like ClinVar or HGMD with known associations to specific diseases or phenotypes may be prioritized.
Pathway or Gene Set Filters
Variants affecting genes within relevant biological pathways or gene sets associated with the phenotype of interest may be given higher priority.
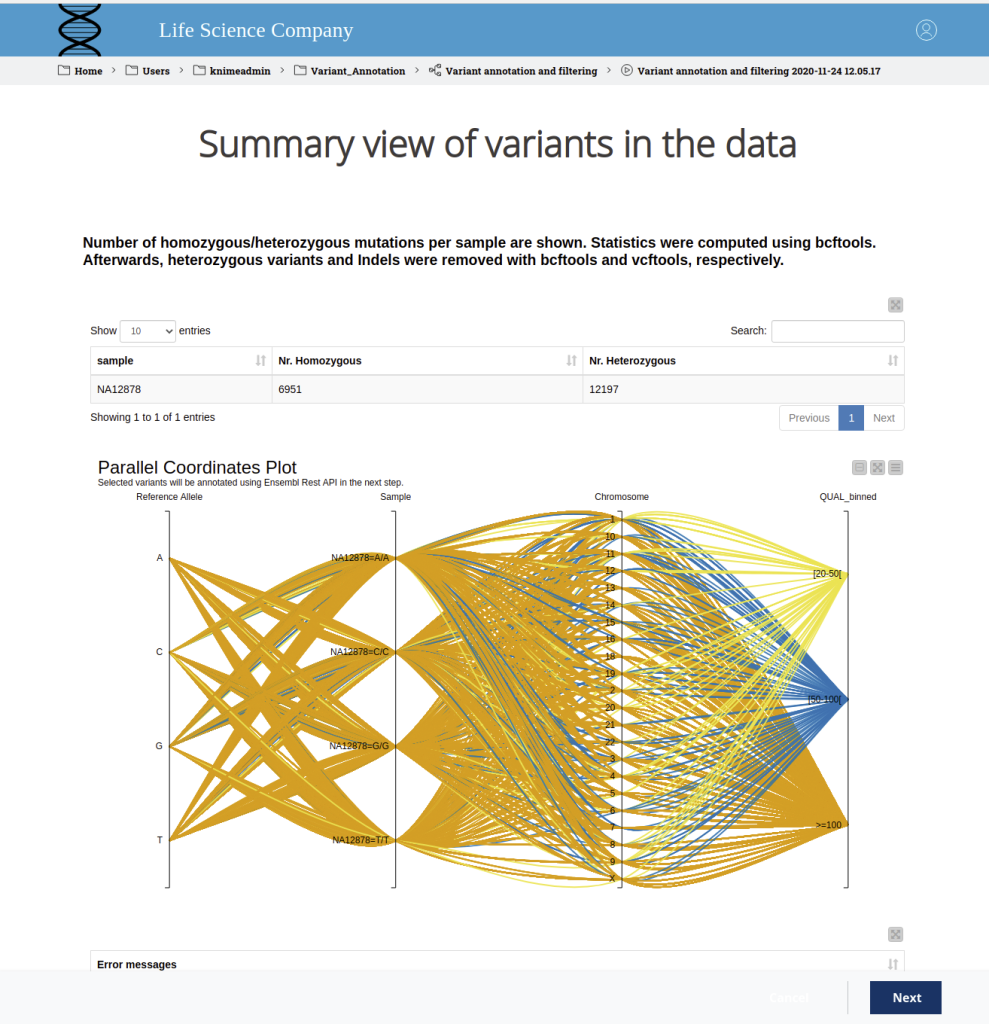
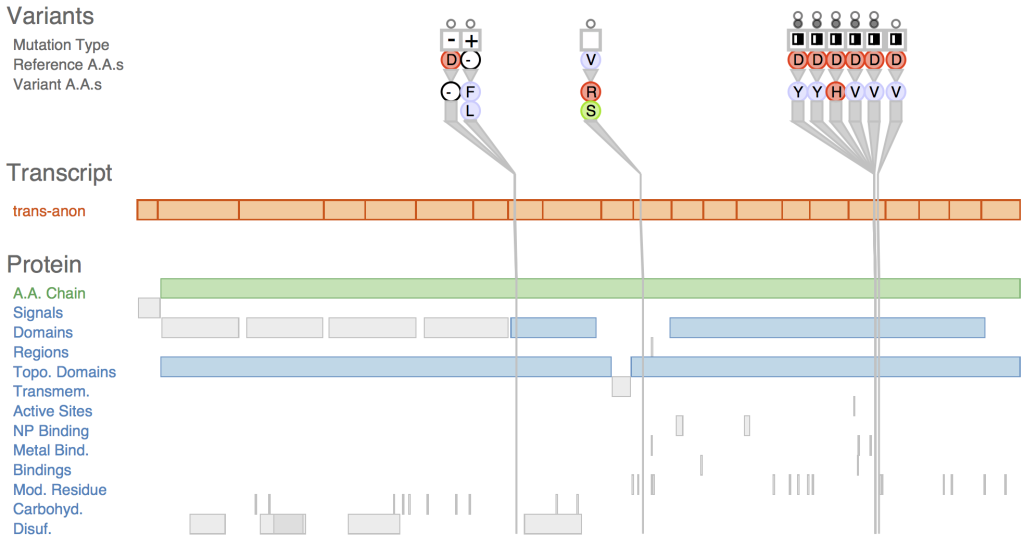
VARIANT VISUALIZATION
Variant visualization allows researchers and clinicians to explore and interpret genomic variations in a graphical format. Effective visualization tools help in understanding the distribution, nature, and potential functional consequences of variants within the genome.
Importance of Variant Visualization
Visual Inspection: Variant visualization provides a comprehensive overview of the genomic landscape, enabling researchers to visually inspect the distribution of variants across chromosomes and genomic regions.
Variant Context: Visualization tools facilitate the examination of variants in their genomic context, including nearby genes, regulatory elements, and functional annotations, aiding in the interpretation of their potential impact.
Identification of Structural Variants: Visualization allows the identification of larger structural variants, such as insertions, deletions, inversions, and copy number variations (CNVs), which are crucial in understanding complex genomic rearrangements.
Comparative Genomics: Visualization helps researchers compare variants across different individuals, populations, or species, identifying shared or population-specific variations.
Prioritization of Variants: Visualization aids in the prioritization of variants based on their functional annotations, allele frequencies, and clinical relevance.
TYPES OF VARIANT VISUALIZATION
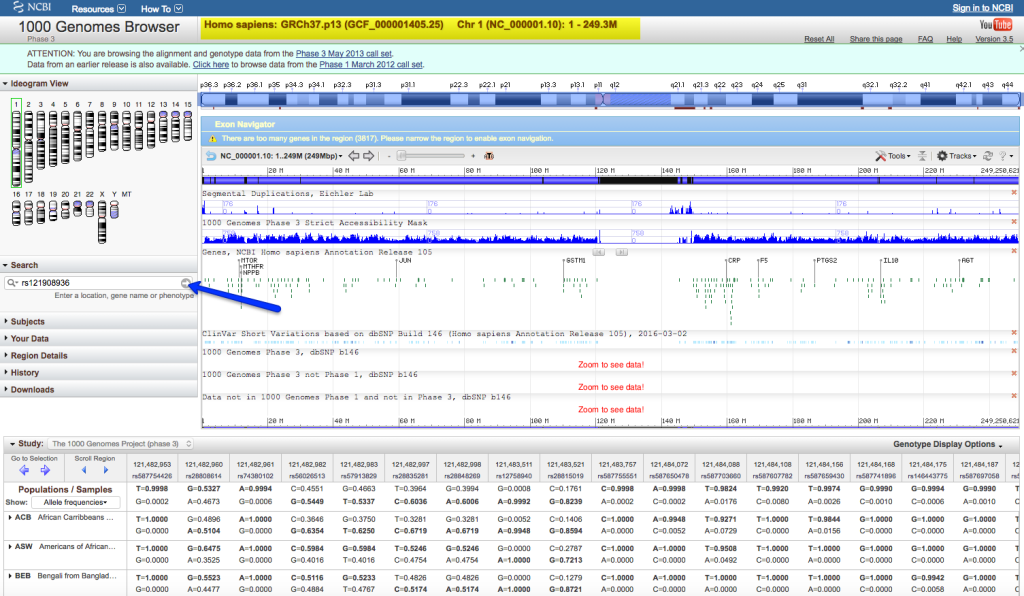
Genome Browser
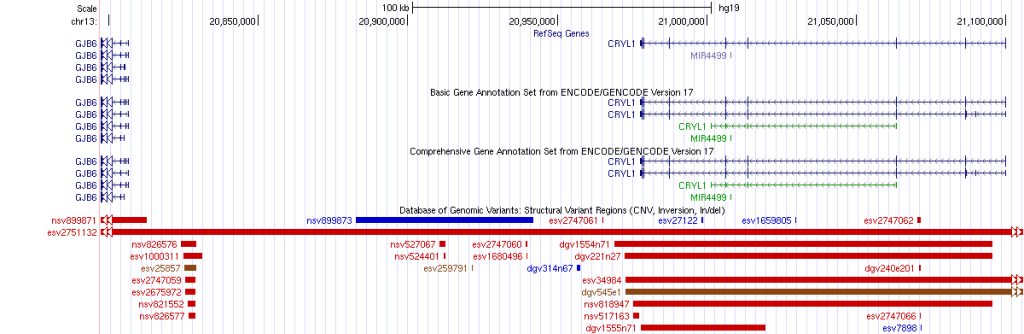
Genome browsers, such as the UCSC Genome Browser and Ensembl, provide a web-based interface to visualize genomic features, including gene annotations, transcripts, and genetic variants. Researchers can overlay variant tracks onto the genome browser, allowing for an interactive view of variants within the context of the reference genome. Zooming and panning features enable detailed inspection of specific genomic regions.
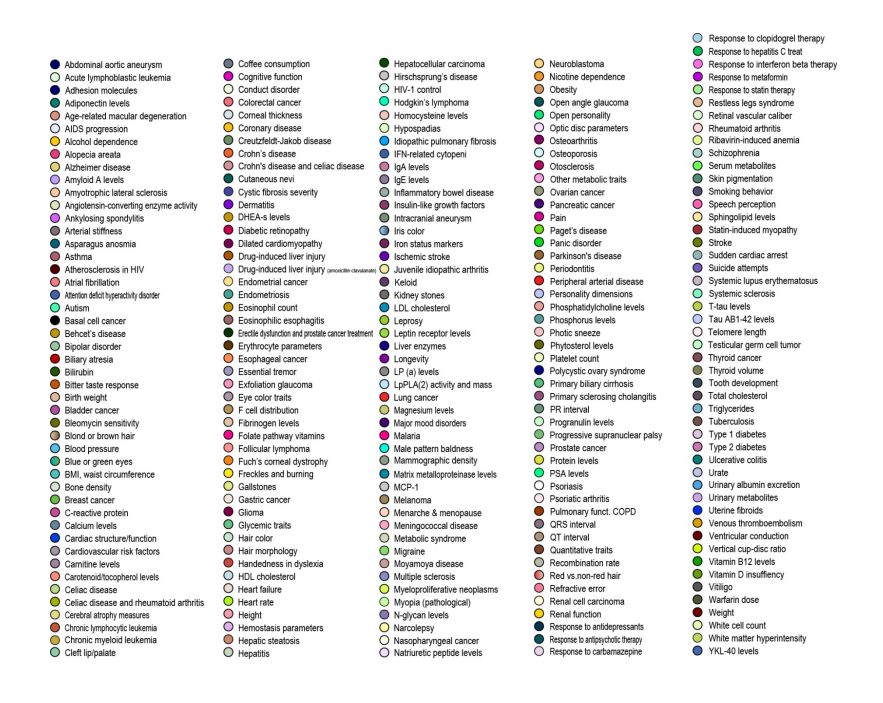
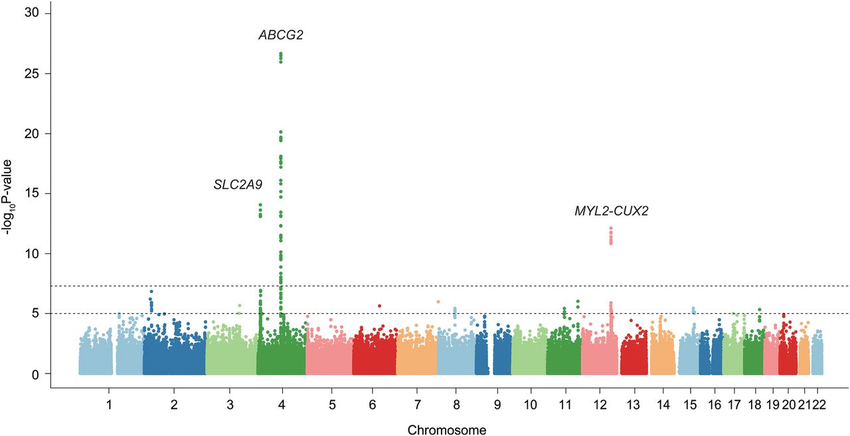
Manhattan Plot
Manhattan plots are used in Genome-Wide Association Studies (GWAS) to visualize the distribution of genetic variants across the genome. Variants are plotted based on their genomic positions and significance (p-values) on the y-axis, with chromosomes represented on the x-axis. Clusters of significant variants are often indicative of regions associated with particular traits or diseases.
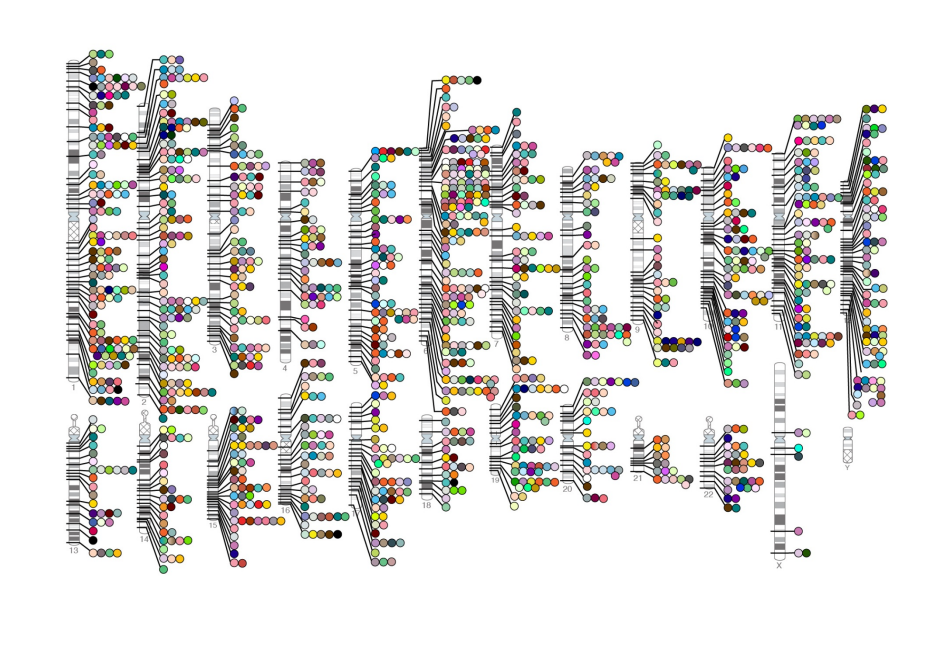
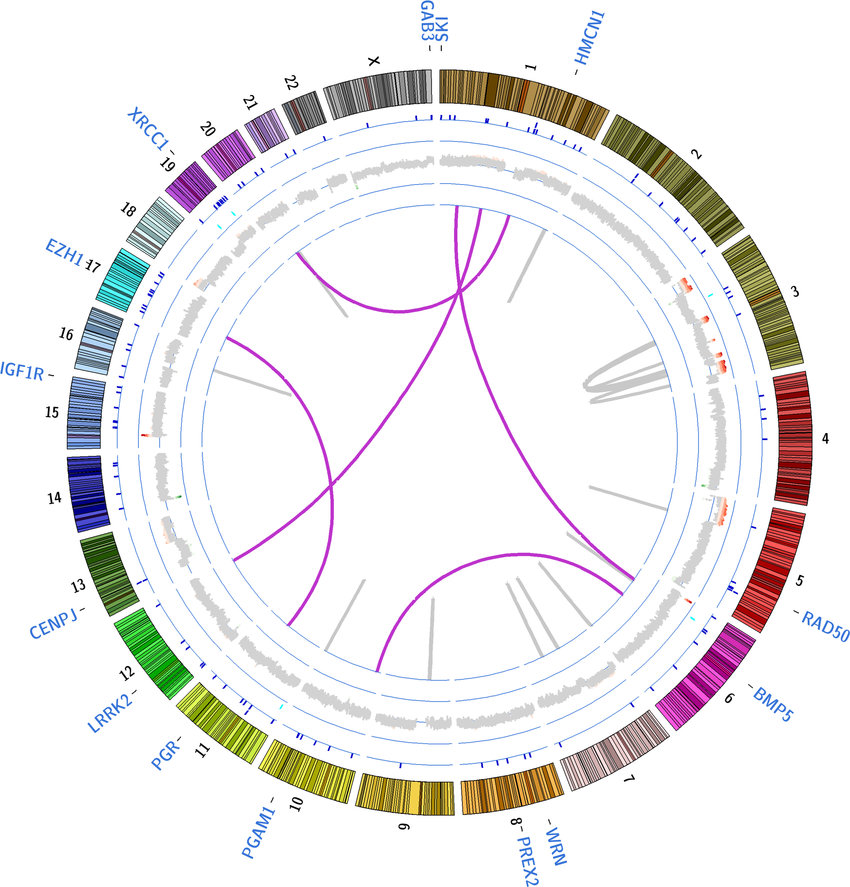
Circos Plot
Circos plots are circular representations of genomic data, illustrating connections between different genomic elements, including genetic variants. Circos plots can show relationships between variants, gene expression, chromosomal rearrangements, and more. They are particularly useful for visualizing complex interactions and genomic rearrangements.
Bar Plots and Heatmaps
Bar plots and heatmaps are used to represent variant frequencies, allele counts, or other variant characteristics across different samples or populations. Bar plots are simple graphical representations that display data as rectangular bars of varying lengths. In the context of variant analysis, bar plots are often used to visualize the frequency or count of specific categories or events. Each bar represents a category, and the length of the bar corresponds to the count or frequency of variants falling into that category.
Heatmaps are graphical representations of data where individual values in a matrix are represented using colors. In variant analysis, heatmaps are employed to visualize patterns or relationships between variants and samples or between variants and genomic features.
While both bar plots and heatmaps are used for visualizing variant data, they serve different purposes. Bar plots are ideal for showing the frequency or count of specific variant categories or genomic features, while heatmaps are better suited for visualizing variant distributions across samples or identifying patterns in variant profiles.
IGV (Integrative Genomics Viewer)
IGV is a specialized desktop tool for interactive exploration of genomic data, including NGS data and variants. Researchers can load their data and visually inspect alignments and variants, zooming in to explore specific regions in detail. IGV is employed in various genomics research areas, including cancer genomics, rare disease diagnosis, functional genomics, and epigenetics. It aids researchers in understanding the genomic landscape of diseases, identifying potential disease-causing variants, and gaining insights into gene regulation and expression patterns.
Tackling the Complexity of Variant Prioritization
As the ultimate goal of tertiary NGS data analysis is to identify disease-causing variants or mutated genes, variant prioritization tools play a crucial role in aiding researchers and clinicians. Tools like PHIVE utilize animal model data to explore similarities between human disease phenotypes and knockout experiment results.
Deleteriousness scoring algorithms evaluate the intolerance of genes to normal variation and rank genes based on their likelihood to cause disease. Human Phenotype Ontology (HPO) provides an association between clinical features and known disease genes, facilitating phenotype-driven variant prioritization.
Moreover, commercial software and medical genetics companies offer user-friendly interfaces for the interpretation and prioritization of variants, supporting clinicians in making precise diagnoses.
Unlocking a More Personalized Genomics
Tertiary NGS data analysis represents the critical bridge between raw sequencing data and its clinical interpretation. Variant annotation, filtering, prioritization, and visualization are essential steps in making sense of the vast array of genetic variants, connecting them to observed phenotypes, and ultimately unraveling the mysteries of human genetics and disease. As technology advances and databases grow, continued efforts in software development and standardization will be essential in improving the accuracy and efficiency of tertiary NGS data analysis. Only through these collective efforts can we unlock the full potential of NGS in clinical genetics and personalized medicine.
Challenges and Pitfalls in NGS Data Analysis
Despite the groundbreaking advancements and transformative potential of Next-Generation Sequencing (NGS), this cutting-edge technology comes with its fair share of challenges. The most prominent obstacle faced by laboratories is the high cost associated with NGS procedures. The initial investment required to acquire state-of-the-art sequencing machines and the recurring expenses for consumables, bioinformatic tools, and data storage can be prohibitive for many institutions, especially those with limited financial resources. As a result, access to NGS may be restricted, hindering the widespread implementation of this powerful tool in research and clinical settings.
Another critical concern that arises with the widespread use of NGS is data sharing and confidentiality. NGS generates an unprecedented volume of genomic data, making data management and sharing a daunting task. While sharing data is crucial for scientific progress and collaborative research, it also raises concerns about data privacy and potential privacy breaches. Genomic information is highly sensitive and can reveal intimate details about an individual’s health and genetic makeup. Striking the right balance between open data sharing for research purposes and safeguarding patient confidentiality becomes a delicate challenge for the scientific community and policymakers.
Technical limitations further compound the challenges associated with NGS data analysis. PCR amplification bias can introduce errors during the sample preparation process, leading to a biased representation of certain genomic regions. Sequencing errors, albeit rare, can also occur during the sequencing procedure, potentially affecting variant detection accuracy. Additionally, read alignment issues can arise when attempting to match short DNA sequences to the reference genome, particularly impacting the detection of small insertions or deletions. These technical limitations require careful consideration and validation to ensure the reliability of NGS results.
Correlating genetic findings obtained through NGS with relevant medical information is an intricate and time-consuming task, particularly when dealing with new variants or genes without established associations. Validating the pathogenicity of novel variants requires rigorous research and evidence gathering to confidently link them to specific diseases or conditions. This process demands collaboration among researchers, clinicians, and bioinformaticians to thoroughly interpret and understand the implications of identified genetic variants.
Crucially, clinicians and patients need to recognize that a positive result from NGS analysis does not always equate to a straightforward solution or a definitive cure. While NGS can provide essential insights into the genetic basis of diseases and aid in diagnosis, it does not guarantee a magical cure or a radical change in prognosis. Genetic counseling becomes indispensable to help patients and their families understand the implications of genetic findings and make informed decisions about their healthcare options. It is vital to manage expectations, provide accurate information, and offer emotional support throughout the genetic testing and counseling process.
In conclusion, while NGS offers remarkable benefits in advancing our understanding of the human genome and its role in health and disease, it also presents significant challenges. Addressing the high costs, data privacy concerns, technical limitations, and complexities of genetic interpretation requires a collective effort from the scientific community, policymakers, and healthcare professionals. Only through proactive measures and responsible utilization of NGS can we unlock its full potential and pave the way for a more precise and personalized approach to medicine.
Engr. Dex Marco Tiu Guibelondo, BS Pharm, RPh, BS CpE
Editor-in-Chief, PharmaFEATURES

Subscribe
to get our
LATEST NEWS
Related Posts

Bioinformatics & Multiomics
Data Deluge: Why Biomedical Informatics Must Reengineer Itself for the Era of Scientific Big Data
Biomedical big data is the scientific infrastructure that turns massive biological and clinical information streams into actionable medical knowledge.

Bioinformatics & Multiomics
Network Medicines: How AI is Teaching Small Molecules to Think in Pathways
AI-driven polypharmacology treats a small molecule not as a single-target bullet, but as a network-calibrated intervention designed for the real complexity of human disease.

Bioinformatics & Multiomics
Agentic Bioinformatics: How Autonomous AI Agents Compress Biomedical Discovery Cycles
Agentic bioinformatics treats biomedical discovery as a closed-loop system where specialized AI agents continuously translate intent into computation, computation into evidence, and evidence into the next experiment.

Bioinformatics & Multiomics
Proteomic Signatures: Molecular Discrimination of Hyperinflammatory States Through Serum Proteome Architecture
Serum proteomics exposes how sepsis and hemophagocytic syndromes diverge at the level of immune regulation and proteostasis, enabling precise molecular discrimination.
Read More Articles


Medicinal Chemistry & Pharmacology
April 14, 2026
Igor Nasonkin and Phythera Therapeutics: Moving Oncology Beyond Single Targets into Engineered Polypharmacologic Systems
Igor Nasonkin’s systems-driven approach at Phythera Therapeutics reframes oncology drug development from single-target inhibition to AI-enabled polypharmacologic network modulation using nature-derived molecular architectures.


Artificial Intelligence and Data Analytics
April 10, 2026
Inside Johnson & Johnson’s External Innovation Engine: Devin Swanson on Translating Integrated Discovery into Strategic Value
Devin Swanson’s leadership at Johnson & Johnson Innovative Medicines redefines external innovation as a tightly governed, AI-enabled translational system integrating multi-modal drug discovery, biomarker strategy, and capital-efficient execution.

Immunology & Oncology
April 9, 2026
From DMPK to Distributed Execution: Mehran F. Moghaddam’s Systems Strategy at OROX BioSciences, Inc.
A systems-level examination of how Mehran F. Moghaddam operationalizes DMPK, externalized R&D, and lipid-mediated therapeutics into a predictive, high-velocity biotech development architecture.